Let’s Get Personal: Does Personality Matter for Decision Makers?

Let’s Get Personal: Does Personality Matter for Decision Makers?

Personality is one of the most extensively studied areas in psychology. Personality has a substantial genetic component, is difficult to modify, and tends to be relatively stable across the lifespan (though subtle trait-level changes do occur). Research on personality and decision-making has repeatedly demonstrated that under different decision conditions, certain personality profiles tend to perform better than others. These findings do not suggest that any personality profile is inherently good or bad at decision-making. Rather, recognizing the conditions under which individuals with certain profiles make better or worse decisions allows for targeted interventions.

One widely used framework for describing personality is the Five Factor Model (FFM) developed by McCrae and Costa (commonly referred to as the Big Five). If you are not familiar, the Big Five constitutes a well-established model that groups personality characteristics into five traits, each measured along a spectrum, meaning individuals can score higher or lower on any of them. The five traits are Openness, Conscientiousness, Extraversion, Agreeableness, and Neuroticism. You can use the acronyms OCEAN or CANOE to remember them. As an aside, I used OCEAN as my starting Wordle guess for a long time (because of the vowels) until one day it came back all yellow, and my heart sank when I realized the answer was CANOE (so close to getting it in 1).

Research has examined how each of these traits can influence decisions for better or for worse. While personality traits themselves are relatively stable, being aware of how your personality may bias your decisions is critical if you want to mitigate those biases and improve decisions.

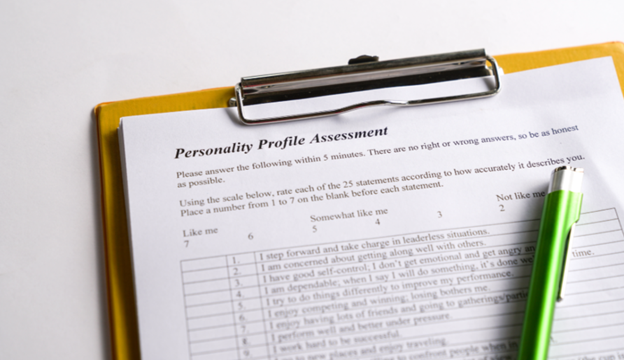
Determining where you fall on these traits is fairly straightforward. Many validated online assessments are free to use. I will link a test at the bottom of this post if you want to see where you fall on the different traits. Be honest when answering if you want accurate results. When I was a psychology professor, I had to remind my General Psychology students that if they truly wanted insight, they had to answer truthfully rather than trying to “game the system” to get socially desirable results. While many of these assessments rely on rating scales and scoring methods that HDR would not fully endorse for high-stakes decision analysis, they are generally validated and directionally consistent for identifying trait tendencies. The short questionnaire linked includes 50 items that reflect the five traits and are summed into composite scores.  While not an HDR-approved measurement tool, these assessments can provide useful insight into traits relevant to decision making.

Going in order of the OCEAN acronym, Openness, formally Openness to Experience, reflects the extent to which individuals are imaginative, intellectually curious, and open to new ideas. Individuals who score high in this trait tend to tolerate ambiguity and uncertainty more comfortably when making complex judgments. Those who score lower tend to prefer structure and familiarity. This dimension is not a reflection of intelligence, but of cognitive style. Highly open individuals may sometimes over-explore possibilities, whereas less open individuals may resist creative alternatives. Awareness of this tendency allows you to introduce structured mechanisms such as pre-mortems to surface alternative perspectives and reduce blind spots.

Conscientiousness reflects how reliable, organized, disciplined, and plan-oriented an individual is. Highly conscientious individuals tend to engage in more structured and careful analysis before acting. In decision-making contexts, this tendency often translates to more deliberate planning and reduced error from oversight. If you score lower on this trait, you may benefit from imposing additional structure, planning checkpoints, and analytical rigor into your workflow. In How to Measure Anything in Project Management, Doug Hubbard and his co-authors, Alex Budzier and Andreas Leed, argue that project managers can often economically justify investing more time in planning and analysis given the high rate of cost overruns and delays in projects.

Extraversion reflects the degree to which an individual seeks stimulation and social interaction. More extraverted individuals tend to be assertive, outgoing, and energized by social engagement, while those lower in extraversion, often referred to as introverts, tend to prefer smaller settings and quieter reflection. Extraversion is relevant to decision-making because it is often associated with greater risk tolerance and faster action. At HDR, we emphasize empirically quantifying organizational risk tolerance. Without doing so, both external factors and internal characteristics such as a leader’s degree of extraversion can unintentionally influence risk-related decisions.

Agreeableness reflects the extent to which an individual is cooperative, warm, and trusting. Highly agreeable individuals may avoid conflict and be less inclined toward skepticism, which can reduce critical evaluation in certain decisions. Conversely, individuals low in agreeableness may provide strong adversarial scrutiny but risk dismissing valid ideas prematurely. A balance between cooperation and healthy skepticism is often ideal for group decision-making. While trait levels themselves are relatively stable, awareness of these tendencies allows individuals to adjust their behavior intentionally.

Finally, Neuroticism reflects emotional reactivity and sensitivity to stress. Individuals higher in neuroticism tend to experience greater anxiety and stress reactivity, which can impair performance in high-pressure decision environments. Under lower-pressure conditions, decision performance among such individuals is often comparable to that of individuals lower in neuroticism. Recognizing how stress interacts with this trait can help decision makers structure environments that mitigate stress‑related decision errors.

Numerous personality models exist (the FFM just being one of them), and many of them provide useful frameworks for understanding how trait tendencies may affect decision behavior. No trait or combination of traits makes someone inherently poor at decision-making; with awareness and the right safeguards, individuals can measurably improve their decisions.


Big Five Personality Test

The Role of Calibration in Risk Analysis

The Role of Calibration in Risk Analysis

HDR’s Calibration Training: Team Calibrator – Hubbard Decision Research

Managing risk requires making decisions under uncertainty, often before complete information is available. One of the most common objections we encounter when working with clients concerns the lack of data to inform quantitative model inputs. When data are easily accessible, leveraging them to generate empirical inputs is straightforward. Gaps still arise, however, or data collection becomes impractical, especially early in a project. Under such conditions, we rely on “calibrated estimates” from subject matter experts (SMEs).

Every measurement instrument requires calibration, whether the instrument involves a precision manufacturing tool or human judgment used in model building. Calibration depends on consistent and unambiguous feedback. Prior to calibration, measurement error is often quite large. Humans tend to be systematically overconfident when making estimates, which introduces error and reduces model realism. Such overconfidence appears both in 90% confidence-interval range estimates and in probability estimates for binary events.

In training more than 3,000 individuals through consulting engagements and standalone programs, HDR has repeatedly observed this pattern of overconfidence. Calibration exercises demonstrably improve performance. Our methods, along with those developed by Philip Tetlock and Roger Cooke—whose pioneering work in this field is well worth reading—align stated confidence with empirical accuracy. Calibration in this context means that a claim of 90% confidence in a range estimate corresponds, across repeated estimates, to correctness approximately 90% of the time within a statistically allowable error range.

Figure 1 illustrates the typical pattern observed for calibration improvement over time. Despite systematic improvement, several confidence levels remain difficult for aggregated groups to calibrate perfectly. Slight overconfidence commonly appears when individuals state 50% confidence in a binary event. Such statements suggest complete uncertainty, yet outcomes across many trials indicate the presence of some informational advantage. Slight overconfidence also appears near the 100% confidence level, where allowable error approaches zero. To address these residual effects, estimates are aggregated across multiple experts and adjusted using each expert’s observed calibration performance. Aggregation reduces individual bias, and final calibration adjustments further fine-tune estimates, producing more reliable inputs for decision models.

Figure 1


Improved estimation quality forms a critical component of the Applied Information Economics (AIE) framework. Organizations frequently face data gaps. A common reaction treats further analysis as impossible until those gaps are filled, prompting immediate, large-scale data collection. In contrast, AIE emphasizes decision definition and measurement of current knowledge before engaging in such efforts. As illustrated in Figure 2, the framework uses quantitative analysis to show where reducing uncertainty would meaningfully affect the decision.

Figure 2


AIE helps organizations avoid a common decision-making pitfall: Measurement Inversion. As termed by Doug Hubbard, the Measurement Inversion describes a repeatedly observed pattern in which organizations measure and collect data on factors that have little or no effect on decisions. Millions of dollars can be poured into these efforts. Doug Hubbard often remarks, “I honestly wonder how this doesn’t impact the GDP.”  A reasonable response is that it probably does.

The first step of AIE, defining the decision, focuses on the choices under consideration, the outcomes that matter, and the uncertain variables that influence those outcomes. Risk analysis supports better decisions about which risk-reduction actions best serve the organization. Every organization faces many possible mitigations, controls, and initiatives, but determining which are justified requires quantitative analysis. Clear decision definition provides the foundation for prioritization.

Identification of variables that merit additional measurement follows from the next two AIE steps: modeling current knowledge and computing the value of additional information. Modeling current knowledge involves populating the model with “arm’s-reach” data and calibrated estimates. Calibration training ensures that uncertainty around each estimate is represented appropriately. Once the model is populated, analysis proceeds to calculation of the value of information (VOI), which indicates where additional measurement is worth the effort.

For example, consider a hypothetical capital project planning a major facility upgrade. Early cost and schedule data are incomplete, and the team considers delaying approval to collect detailed estimates across all work packages. AIE modeling using calibrated estimates shows that uncertainty in a small number of long-lead components drives most of the risk, while uncertainty in routine tasks has little impact on the decision. VOI analysis confirms that broad data collection would not change the outcome, whereas targeted measurement would.

VOI quantifies the economic impact of reducing uncertainty in specific model inputs. Ron Howard, a founder of decision analysis, introduced the concept in the 1960s, yet organizations still apply it infrequently. Many variables exhibit negligible information value, indicating that additional data collection or analysis would not affect decisions.

Before taking on a large data-collection effort, pause and ask whether that effort is actually justified. Avoid falling prey to Measurement Inversion. In many cases, decisions improve more from well-calibrated estimates than from indiscriminate data gathering. AIE provides a structured way to use calibrated judgment and value-of-information analysis to focus measurement on uncertainty that truly matters and to support better decisions.

Power Law vs. Lognormal Distribution: Which is the Right Choice for My Model?

Power Law vs. Lognormal Distribution: Which is the Right Choice for My Model?

At Hubbard Decision Research, we’ve built dozens upon dozens of risk models for companies of different sizes across wildly diverse areas. One of the questions we sometimes get from the more quantitatively affluent clients is “Should we use a power law distribution or a lognormal distribution to model the impact of this risk?”. On the surface, it seems like a simple question. However, when you’re dealing with highly uncertain ranges for some impacts, the question gets a bit more complicated. Ultimately, the choice comes down to a few key components: Identifying which approach best fits your data, understanding the uncertainties regarding growth and tail behavior, as well as existing assumptions regarding a specific impact (such as the natural limit of the impact or how the impact scales).

Both power law distributions and log normal distributions are relatively common in quantitative risk modeling. They have some similarities because neither can result in a zero or negative value in a simulation and both have larger positive tails (which is very important in capturing ranges of impacts). However, the difference between them can drastically alter decisions if you’re not careful. Choosing a lognormal distribution when the data really fits a power law would result in you underestimating your losses by potentially astronomical amounts. Choosing a power law when the data really fits a lognormal could result in overprioritizing smaller risks when they were not really justified. Both of these scenarios are not ideal and having the flexibility to accurately fit your data to the correct distribution is essential for prioritizing mitigations or controls (especially large portfolios of mitigations/controls).

How do you choose which to use? There are a few approaches to this, and the most noticeable differences live in the tail of the distributions. A power law distribution assumes that these extreme events happen more often than a lognormal does. If your business decisions depend on how, you treat these rare events, this difference can have a big impact. If you’re worried about a few massive events driving most of your losses, and your data suggests there’s no natural limit to how bad things can get, the power law might be the better fit compared to a lognormal distribution. On the other hand, if you’re modeling something that tends to grow or spread gradually, like cost overruns or delays, with a known limit for about how bad losses/impacts can be, the lognormal could be more realistic alternative.

One of the key differences to understand is how each distribution handles growth. A lognormal distribution assumes a steady, compounding process, like many small risks building up over time. For example, if you are modeling network risk, equipment ages and wears out over time. Those losses would likely accumulate steadily and fit a lognormal distribution.  A power law, on the other hand, assumes a more chaotic buildup, where both the size and number of risks can grow unpredictably. In our network risk example, this might be reflected best in large internet outages or application outages which are triggered by uncertain yet cascading failures. So, while lognormal reflects consistent compounding, power law reflects compounding under deep uncertainty.

The best-case scenario is to use the data you have available to compare which distribution fits best. Also, there is a lot of historical precedence for the use of certain distributions so don’t fly solo if you don’t have to. An axiom we have at HDR is that it has probably been measured before. Look at what others have done and the rationale for why they have done so as you make your choice. Risk modeling isn’t about being perfect, it’s about improving upon the existing approach. If you’re currently using qualitative or pseudo-quantitative approaches like scales or scores, either option will probably move you in a better direction. On the book website (linked at the bottom) you can find a spreadsheet that goes with Appendix A where you can input elements to generate both lognormal distributions and power law distributions. I encourage you to experiment with these and familiarize yourself with the characteristics of these distributions. In Figure 1, I used a simple simulation with 1000 trials comparing monetary losses using a Lomax power law and a lognormal distribution which have the same average which highlights the need to understand the general trends of the data, as well as the assumptions outlined earlier.

Figure 1: Simulation Output Power Law vs. Lognormal with the Same Mean


Don’t let perfect be the enemy of good (to quote Voltaire). However, recognize when and where different distributions can and should be used. If this is something you’re having trouble with, HDR helps clients with this on a daily basis. Measure what matters, make better decisions, and keep moving in the right direction.

How To Measure Anything in Cybersecurity Risk | Downloads

Are Your KPIs Actually KPIs?

Are Your KPIs Actually KPIs?

In nearly every organization, Key Performance Indicators (KPIs) are a staple of performance tracking and strategy alignment. But how often do we stop to question whether our KPIs are truly key, or even indicators of performance? Was there an analysis done to evaluate the efficacy of these KPIs? At what value, for a given KPI, do we need to take action or intervene? From what we’ve seen, that answer to these questions often leaves a lot to be desired.

Too often, businesses select KPIs that are not actually impactful but provide a false sense of security because data is being analyzed and tracked. We see organizations track metrics like total page views, hours worked, or number of meetings scheduled that tell us little about actual business outcomes. These metrics are often shown on a dashboard and are not tied to any specific decision or intervention.

Effective KPIs should be tied directly to a decision. If a KPI doesn’t drive an action or inform a choice, it’s just adding to the noise. For example, tracking average customer response time is only valuable if it helps improve satisfaction or retention. For example, at what level of customer response time does it become justifiable to intervene to protect retention? If it’s measured but ignored, it’s not a KPI, it’s background data. While that may be useful or worth tracking, if it isn’t impacting decisions or flagging areas to intervene, it’s not a KPI.

At HDR we have observed a phenomenon called the Measurement Inversion (see Figure 1) in almost every single industry we’ve worked in. Organizations are often measuring and tracking data (at great expense) that has no actual influence on a decision. When we run information value calculations in decision models, we routinely see little-to-no value in the metrics that are being tracked and massive value for other metrics in the model (metrics that could actually influence a decision one way or the other).

Figure 1: Depiction of the Measurement Inversion


At the end of the day, KPIs are not only about data, they’re about decisions. The most valuable metrics illuminate what matters, show what’s working, and prompt better actions. If your current KPIs don’t do that, it’s time to rethink what you’re measuring and how you’re measuring it.

The Role of Noise in Risk Management

The Role of Noise in Risk Management

The Role of Noise in Risk Management: A psychologist’s take on an often underappreciated and often misunderstood topic.

Prior to working in management consulting, I was a career academic. I taught a variety of psychology courses at a university and conducted cognitive psychology research (although I also engaged in large-scale replication work trying to address fundamental issues in how psychological science was conducted). Through my doctoral training, research, and professional experience in the field, I began to become acutely aware of how misconceptions or misunderstandings of key elements of psychology and neuroscience have crept into society’s day-to-day topics. Risk management, as a discipline, is no different. While there are certain elements of psychology within risk management, such as things like cognitive biases, which are reasonably well understood, communicated, and applied to risk management problems, there are others where I still see gaps (which is only natural).

One key element I think most people inherently understand about psychology is that as a discipline, it approaches the same problem or situation from multiple layers of analysis which all mesh together in our larger understanding and appreciation of our own reality. This ranges from rather large macro-level elements within social psychology and reduces all the way to cellular (and in some instances sub-cellular) levels within the nervous system. My area of expertise sits in the cognitive layer with a large emphasis on how neurological principles and cognitive function are related. From a basic science perspective, that is what always interested me as a researcher. One of the areas in this layer I was fascinated by was the concept of noise. Thanks to popular researchers, like the late Daniel Kahneman, the idea of noise in risk management has gained some traction in recent years. However, the element of noise I was interested in was far more fundamental than what Kahneman was describing. I was interested in neural noise and how it changes, and fundamentally increases, across the lifespan. I won’t go into all of the details here but essentially; neural noise influences every single element of cognitive processing from the sensory input stage all the way to behavioral output. Furthermore, the distribution of noise fundamentally increases over time as we age (2nd law of thermodynamics).

When people think about noise in risk management, I think they often miss the boat a little bit. They understand the elements that Kahneman describes in the book, which is a great starting point, but they miss the bigger picture. Every single thought, sensation, behavior, social interaction, and so on, is influenced by noise. Even the simplest of perceptual tasks are measurably influenced by noise. In the field of experimental psychology and psychophysics (no not crazy physics as fun as that would be) these concepts have been fundamental to how we think about perception, behavior, and the underpinnings of decision-making for over 150 years (dating back to Weber-Fechner Laws) and beyond. Concepts like “discriminal dispersion” which was introduced by Thurstone almost a hundred years ago (building on Weber’s and Fechner’s foundations) in his paper “The Law of Comparative Judgement”. Furthermore, these elements have been studied and expanded upon consistently over the past 50 years. Work from Lester Krueger and Philip Allen (and many others there is a long list of great researchers that spring to mind, but I won’t list them all out) inspired me to study this more and more. Interestingly, all of the probability concepts that are covered in the more quantitatively rigorous areas of risk management and probability theory align perfectly with these ideas which was largely my inspiration for joining Hubbard Decision Research in the first place.

Tying this back to risk management and the broader inspiration for me writing this came from a recent podcast titled “Unlocking Resilience. Mass Media & Prioritization.” with Brandon Daniels and David Merritt (I’ll put the link to that podcast at the bottom as it’s worth a listen). There is a lot of great substance in the podcast, but one key point stuck out to me which was made by David Merritt around the 19-minute mark in the podcast and it has to do with how to prioritize human attention and, ultimately, optimize those precious finite human resources. While this was one item in a broader conversation, it made me stop on my walk with my dog and write down a note on my phone’s notepad. Human attention, human cognition, and human performance in general is fundamentally influenced by noise and developing a risk quantification framework that buttresses and supports decision makers in the face of inevitable (and neurologically fundamental) noise is essential. Risk management at large organizations is complicated; there are so many moving pieces. Providing the right people with the right tools to make better strategic decisions under uncertainty and target the right risks ultimately requires a consistent, unambiguous, and stable approach to risk management despite the internal noise that we deal with as biological beings.

Doug Hubbard repeatedly says when we talk to clients (and he’s not alone in the risk quantification space with this) that “I’d rather not have to do that math in my head”. The field of quantitative risk management is, in essence, eclectic with psychology being an important, and often overlooked area. Understanding how foundational concepts within psychology apply to risk management is a competitive advantage. Essentially, every single cognitive process is in some way limited or capped. Recognizing those limitations and developing solutions to minimize the impact of those limitations (such as developing quantitative risk models rather than relying on unaided intuition or replacing sub-optimal qualitative scoring approaches which actually add more noise with even simple quantitative models) will protect organizations from their best (yet most flawed) asset, their people (most flawed might be an exaggeration but it helps get the point across).

Unlocking Resilience. Mass Med… – Cybercrime Magazine Podcast – Apple Podcasts