by Joey Beachum | Feb 27, 2020 | Announcements, How To Measure Anything Blogs, News
Over 12 years ago, on August 3, 2007, the first edition of How to Measure Anything was published. Since then, Doug Hubbard has written two more editions that now have sold over 100,000 copies in that series alone – copies purchased by customers ranging from university professors, scientists, and government officials to Fortune 500 executives, Silicon Valley visionaries, and global leaders in virtually every industry under the sun.
The premise of How to Measure Anything remains true all these years later: that anything can be measured, and if you can measure it – and it matters – then you can make better decisions. These measurement challenges that we’ve overcome over the past 12 years have included:
- the most likely rate of infection for COVID-19
- drought resilience in the Horn of Africa
- the value of “innovation” and “organizational development”
- the risk of a mine flooding in Canada
- the value of roads and schools in Haiti
- the risk and return of developing drugs, medical devices and artificial organs
- the value and risks of new businesses
- the value of restoring the Kubuqi Desert in Inner Mongolia
- the value and risks of upgrading a major electrical grid
- near and long-term reputation damage from data breaches
In addition to learning how to better understand critical measurement concepts by reading How to Measure Anything, thousand of customers from all over the world have obtained proven, industry-leading quantitative training via our series of online webinars and in-person seminars. This includes the ever-growing line of How to Measure Anything-inspired webinars in key areas like:
- Cybersecurity
- Project Management
- Innovation
- Public Policy and Social Impact
- Risk Management
More are on the way. (Do you have an area you’d like us to cover in our training? Tell us here.)
Through this series, they’ve become more calibrated and have learned how to calibrate others in their organizations. They’ve learned how to build their own Monte Carlo simulations in Excel from scratch – no special software needed. They’ve learned how to move away from pseudo-quantitative methods like risk matrices and heat maps in cybersecurity. And they’ve learned how to figure out what’s worth measuring by performing value of information calculations. These are just a few examples of the practical skills and takeaways our customers have received since How to Measure Anything was first published.
We’re also planning on taking quantitative training to the next level in an exciting and ground-breaking development that will be announced later this year.
The era of measurement – the pursuit of modern science – began in 1687 with Newton’s Principia. Finding better ways to create better measurements is the logical next step in the evolution we’ve seen over the past four centuries, and How to Measure Anything will continue to do its part as the world continues further down an uncertain path. Thanks for being a part of the journey. We look forward to what’s to come and hope you continue on with us.
by Joey Beachum | Mar 27, 2019 | Announcements, Articles, General Topics, News
 Science, we have a problem. Several problems, actually. Now we have solutions. A central tenant of modern science is that experiments must be reproducible. It turns out that a surprisingly large proportion of published results in certain fields of research – especially in the social and health sciences – do not satisfy that requirement. This is known as the reproducibility crisis.
I was honored to have the opportunity to be involved in addressing this as both an associate editor of a ground-breaking special Issue of The American Statistician and to co-author one of the 43 articles. This special issue is called “Moving to a World Beyond p<.05” Some of my readers will recognize that “p<.05” refers to the “significance test”, ubiquitous in scientific research. This issue is the first serious attempt to fundamentally rethink statistical inference in science since the significance tests currently used were developed almost a century ago.
The article I authored with Alicia Carriquiry (Distinguished Professor of Statistics at Iowa State University) is titled Quality Control for Scientific Research: Addressing Reproducibility, Responsiveness, and Relevance. We argue that addressing responsiveness and relevance will help address reproducibility. Responsiveness refers to the fact it takes a long time before problems like this are detected and announced. The discovery of the current problems of reproducibility only occurred because, periodically, some diligent researchers decided to investigate it. Years of unreproducible studies continue to be published before these issues are known and even longer before they are acted on.
Relevance refers to how published research actually supports decisions. If the research is meant to inform corporate or public decisions (it is certainly often used that way) then it should be able to tell us the probability that the findings are true. Assigning probabilities to potential outcomes of decisions is a vital step in decision theory. Many who have been using scientific research to make major decisions would be surprised to learn that the “Null Hypothesis Significance Test” (NHST) does not actually tell us that.
However, Alicia and I show a proof about how this probability could be computed. We were able to show that we can compute the relevant probability (i.e., that the claim is true) and that even after a “statistically significant” result the probability is, in some fields of research, still less than 50%. In other words, a “significant” result doesn’t mean “proven” or even necessarily “likely.” A better interpretation would be “plausible” or perhaps “worth further research.” Only after the results are reproduced does the probability the hypothesis is true start to grow to about 90%. This would be disappointing for policy makers or news media that tend to get excited about the first report of statistical significance. In fact, measuring such probabilities can be the basis of a sort of quality control for science that can be much more responsive as well as relevant. Any statistically significant result should be treated as a tentative finding awaiting further confirmation.
Now, a little background to explain what is behind such an apparently surprising mathematical proof. Technically, a “statistically significant” result only means that if there were no real phenomena being observed (the “null” hypothesis) then the statistical test result – or something more extreme – would be unlikely. Unlikely in this context means less than the stated significance level, which in many of the research fields in question is 0.05. Suppose you are testing a new drug that, in reality, is no better than a placebo. If you would have run an experiment 100 times you would, by chance alone, get a statistically significant result in about 5 experiments at a significance level of .05. This might sound like a tested hypothesis with a statistically significant result has a 95% chance of being of being true. It doesn’t work that way. First off, if you only publish 1 out of 10 of your tests, and you only publish significant results, then half of your published results are explainable as chance. This is called “publication bias.” And if a researcher has a tendency to form outrageous hypotheses that are nearly impossible to be true, then virtually all of the significant results would be the few random flukes we would expect by chance. If we could actually compute the probability the claim is true, then we would have a more meaningful and relevant test of a hypothesis.
One problem with answering relevance is that it requires a prior probability. In other words, we have to have to be able to determine a probability the hypothesis is true before the research (experiment, survey, etc.) and then update it based on the data. This reintroduces the age-old debate in statistics about where such priors come from. It is sometimes assumed that such priors can only be subjective statements of an individual, which undermines the alleged objectively of science (I say alleged because there are several arbitrary and subjective components of statistical significance tests). We were able to show that an objective prior can be estimated based on rate at which studies in a given field can be successfully reproduced.
In 2015, a group called The Open Science Collaboration tried to reproduce 100 published results in psychology. The group was able to reproduce only 36 out of 100 of the published results. Let’s show how this information is used to compute a prior probability as well as the probability the claim is true after the first significant results and after it is reproduced.
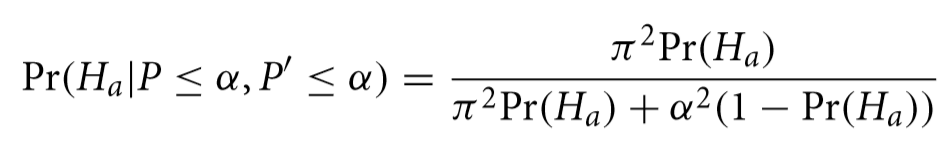
The proposed hypothesis the researcher wants to test the truth of is called “alternative” to distinguish it from the null hypothesis, where the results were a random fluke. The probability that the alternative hypothesis is true, written Pr(Ha), based only on the reproducibility history of a field, is:
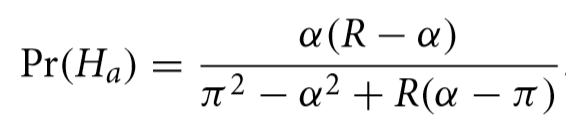
Where R is the reproducibility rate, and α and π refer to what is known as the “significance level” and the statistical “power” of the test. I won’t explain those in much detail but these would be known quantities for any experiment published in the field.
Using the findings of The Open Science Collaboration, R would be .36 (actually we would use those results as a sample to estimate the reproduction rate which itself would have an error, but we will gloss over that here). The typical value for α is .05 and π is, on average, perhaps as high as .8. This means that that hypothesis being considered for publication in that field have about a 4.1% chance of being true. Of course, you would expect that researchers proposing a hypothesis probably have reason to believe they have some chance that what they are testing is true but before the actual measurement, the probability isn’t very high. After the test is performed, the following formula shows the probability is a claim is true given that it passed the significance test (shown as the condition P< α).
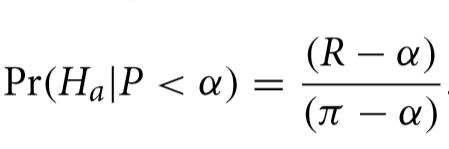
What might surprise many decision makers who might want to act on these findings that that, in this field of research, a “significant” result using an experiment with the same α and π means that now we can say that the hypothesis has only a 41.3% chance of being true. When (and if) the result is ever successfully reproduced it, the probability the hypothesis is true is adjusted again to 91.9% with the following formula.
If we plot all three of these probabilities as a function of reproduction rate for a given α and π, we get a chart like the following.
Probability the hypothesis is true upon initial proposal, after the first significant result and after reproduction
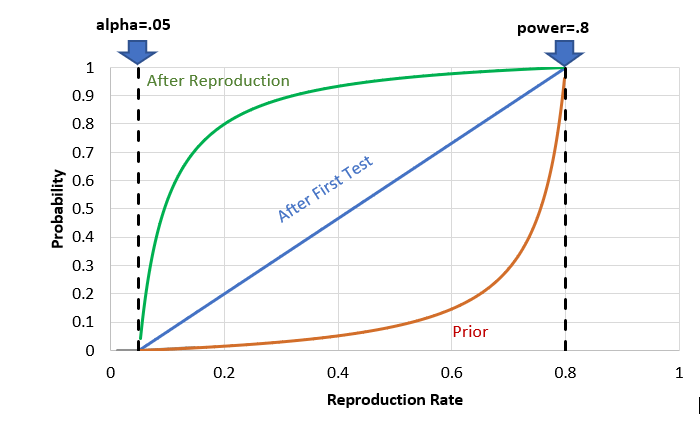
Other reproduction attempts similar to The Open Science Collaboration show replication rates well short of 60% and more often below 50%. As the chart shows, if we wanted to have a probability of at least 90% that a hypothesis is true before making a policy decision, reproduction rates would have to be on the order of 75% or higher holding other conditions constant. In addition to psychology, these findings affect issues as broad as education policy, public health, product safety, economics, sociology, and many other fields where significance tests are normal practice.
Alicia and I proposed that Pr(Ha) itself becomes an important quality control for fields of research like psychology. Instead of observing problems perhaps once every decade or two, Pr(Ha) can be updated with each new reproduction attempt and that will update all of the Pr(Ha|P<a) in the field at a rate closer to real time. Now, our paper is only one of 43 articles in this massive special issue. There are many articles that will be very important in rethinking how statistical inference has been applied for many decades.
The message across all the articles is the same – the time for rethinking quality control in science is long overdue and we know how to fix it.
– Doug Hubbard
by Douglas Hubbard | Aug 3, 2017 | Announcements, Articles, Events, News, Uncategorized, What's New
 On August 3, 2007, the first edition of How to Measure Anything was published. Since then, Doug Hubbard has written two more editions, three more books, in eight languages for a total of over 100,000 books sold. How to Measure Anything is required reading in several university courses and is now required reading for the Society of Actuaries Exam prep.
Over the years, Hubbard Decision Research has completed over 100 major measurement projects for clients in several industries and professions. Clients included The United Nations, the Department of Defense, NASA, a dozen Fortune 500 companies, and several Silicon Valley startups.
Just since the first book, Hubbard Decision Research has trained over 1000 people in the Applied Information Economics methods. HDR has also been given several new measurement challenges including the following:
- drought resilience in the Horn of Africa
- the risk of a mine flooding in Canada
- the value of roads and schools in Haiti
- the risk and return of developing drugs, medical devices and artificial organs,
- the value and risks of new businesses
- the value of restoring the Kubuqi Desert in Inner Mongolia
- the value and risks of upgrading a major electrical grid
- new cybersecurity risks
- ….just to name a few
We have a lot going on in this anniversary year. Here are some ways you can participate.
- Have you been using methods from How to Measure Anything to solve some critical measurement problem? Let us know your story. We will be giving the top 3 entries up to $1,000 worth of How to Measure Anything webinars including your choice of any of the “Intro” webinars, Calibration training, and AIE Analyst training or time on the phone with Doug Hubbard. Send your entry to HTMA@hubbardresearch.com by Friday, August 11.
- We are continuing our research for a future topic “How to Measure Anything in Project Management” If you are in the field of project management, you can help with the research by filling out our project management survey. In exchange, you get a discount on project management webinars and a copy of the final report.
- We are offering an anniversary special for books and webinars for a limited time.
- See Doug Hubbard team up with Sam Savage in Houston and DC for our joint Probabilitymanagement.org seminars on modeling uncertainty and reducing uncertainty with measurements.
SaveSave
SaveSave
by Douglas Hubbard | Mar 4, 2017 | Announcements, News, What's New
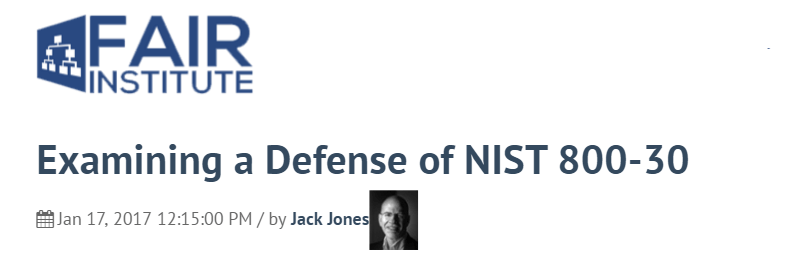
Jack Jones, the inventor of the FAIR method for assessing cybersecurity risk, comments on a defense of NIST 800-30 by someone who commented on one of his blogs. I take Jack’s side on this. For those of you who have read my books, NIST 800-30 is one of the standards that promotes methods I spend a lot of time debunking (ordinal scales for risks, risk matrices, etc.).
(more…)
