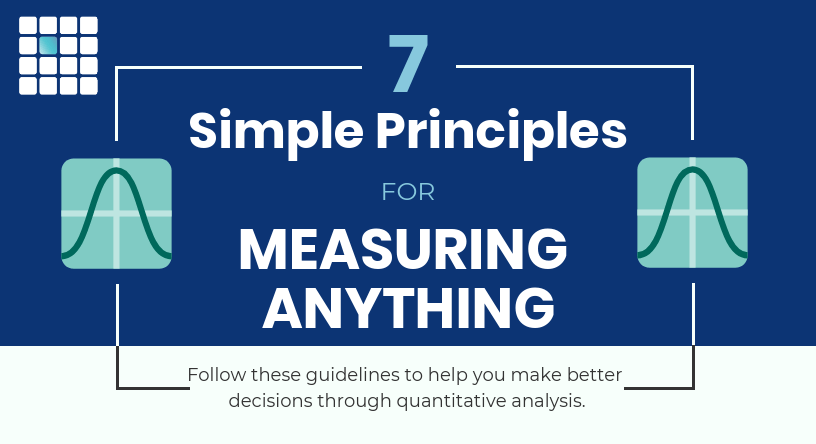
by Robert Weant | Aug 8, 2023 | How To Measure Anything Blogs, Personal Finance
 Tab 1…., Tab 2…., Tab 1.., Tab 2. I was anxiously clicking back and forth between two tabs on Zillow.com for the DC area. One shows the “For Sale” homes in a popular young professional neighborhood, and the other “For Rent” in the same area. Two nearly identical townhouse apartments were on the market, one for a selling price of $375K and the other listed for rent at $1,995 per month. When Googled “Is it better to buy or rent” the results give everyone’s opinion from self-proclaimed financial gurus prophesizing the common adage “Renting is for Suckers” to van living pseudo-philosophers who subscribe to the belief that “You don’t want to be tied down to one place man.” Even Chat-GPT gives me a very ambivalent answer stating, “The decision between buying and renting is complex and depends on many uncertain factors”.
  Fortunately, the company I work for Hubbard Decision Research (HDR), specializes in making decisions given many uncertain factors. Applied Information Economics (AIE), developed by HDR’s founder Douglas Hubbard, provides a practical statistical framework for making this decision or others with high degrees of uncertainty. It employs methods proven by a large body of peer-reviewed academic research and empirical evidence on improving human expert judgments. As a management consulting firm, we are routinely hired by some of the world’s largest companies and government organizations to apply this framework to large difficult decisions. The same framework can be applied to personal financial decisions in a 4-step process.
 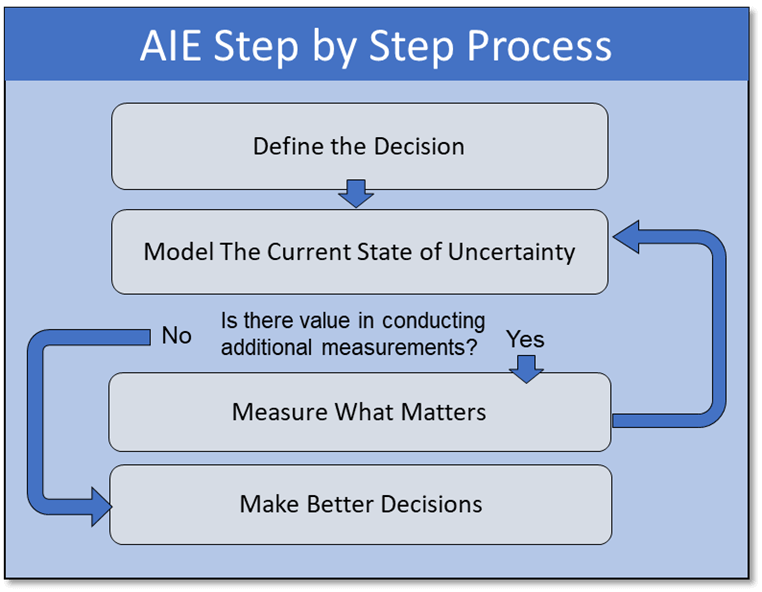 Step 1: Define the Decision Should I buy or rent an apartment? Given that I don’t have any personal preference for homeownership itself, which decision is more likely to lead to a better financial outcome? Step 2: Model What We Know Now
  To model this decision, a Monte Carlo simulation was used to generate 1,000 different possible scenarios based on defined probability distributions for the variables that influence the decision. This may sound complicated at first glance. References to simulations bring up mental images of the Matrix or Dr. Strange using the Time Stone to see 14 million different simulations and only one way to defeat Thanos. But when explained, it’s quite straightforward. Rather than using a fixed value for a variable I’m unsure about such as “Time until reselling of home”, I use a range with a confidence interval. I’m not sure how long I would potentially live in the apartment, but I’m 90% sure it would be between 3-15 years. While I may not possess an infinity stone to see all these simulations, I do possess a tool equally as powerful for practical decision-making: Excel. In Excel, standard cashflow models were built to show how my financial inflows and outflows would compare if I rented or bought one of the apartments, and the net present value (NPV) of the difference was calculated.
 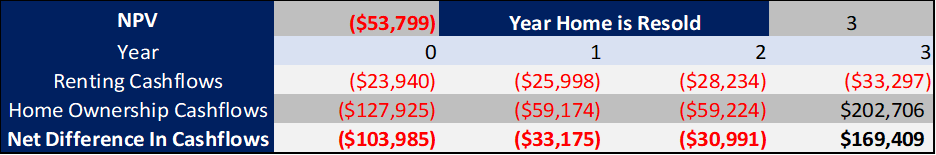 These cashflows were calculated based on 17 different variables that have an impact on the decision. For variables, I am uncertain about, the model randomly samples from a confidence interval provided. The Model repeats this 1000 times and records the Simulated Value, and Cashflows for each simulation.
  Based on the recorded simulated values and cashflows, the model generates a probability distribution for possible NPVs, which will suggest an informed decision. If the expected NPV (average NPV across all situations) is positive, the decision should be to buy; if it is negative, the decision should be to rent.
 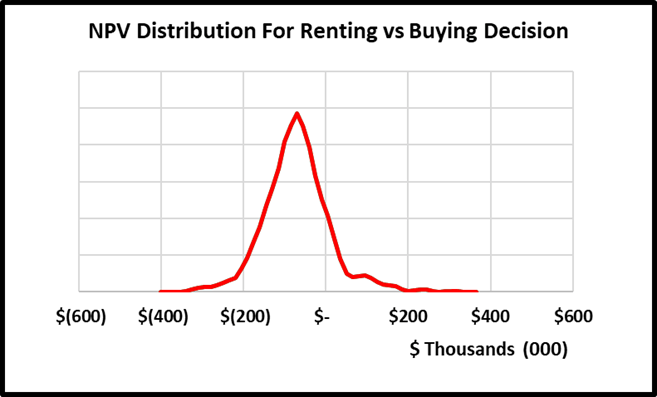 The big caveat is this is based on a probability-weighted outcome, and there is a chance the model suggests the wrong decision. However, there are ways to reduce this probability by conducting additional measurements. Step 3: Measure What Matters: One of the benefits of using Monte Carlo simulations versus deterministic models with fixed values is that we can calculate the expected value of perfect information (EVPI). It is how much a person should be willing to pay to eliminate their uncertainty about a variable. The calculation is essentially the probability of being wrong multiplied by the cost of being wrong.
 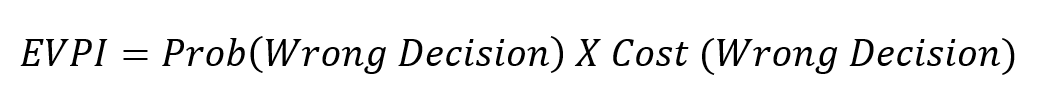 By measuring and ranking EVPIs, we obtain a practical list of the most important uncertain variables to spend time measuring or conducting additional analysis on. If initially, I’m unsure what my mortgage rate would be and give a 90% confidence range of between 4-9%, the maximum I would be willing to pay a bank to give me a precise mortgage quote guarantee would be the EVPI. In this case $1,407.
  The cost for me of spending 15 minutes to get an online mortgage quote is well below this EVPI value. After doing so, I received a quote of 6.7%. Replacing this range with the fixed value and rerunning the model results in a narrower distribution of NPVs as seen below and thus reducing my uncertainty about the decision.
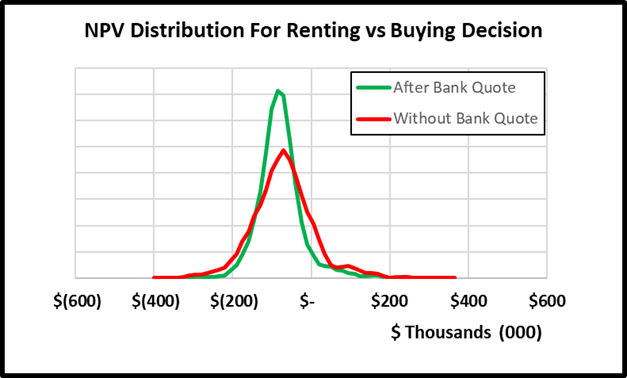
 Changing the mortgage rate from a range to a constant also changes the EVPIs of other variables. While in the original model, I had 4 variables with EVPI values, the updated model shows the only variable worth conducting additional measurement on is the estimated annual increases in home prices over the period of ownership. Unfortunately for me, I do not have a magic crystal ball, nor an oracle I can con pay to tell me precisely what home prices will do in the future. I could spend hours researching the market mechanisms of home price increases to come up with narrower range estimates for the lower and upper bounds. However, based on the EVPI, I do not think the slight reduction in uncertainty is worth it. I can confidently move on to making my decision.
  Step 4: Make Better Decisions:
  The final model results show the expected value of buying versus renting the apartment is $-79,072. In 93.8% of the simulations, I would be better off renting the apartment vs buying the apartment. This conclusion could change as new information becomes available and if mortgage rates start to decrease, but for now I can very confidently make the decision that I’m financially better off renting than buying. Other Applications of AIE: This was a simple example of how Applied Information Economics can improve personal financial decisions. The same steps can be applied to practical large-scale business investments. At Hubbard Decision Research, we routinely apply the same step-by-step process to multi-million or even multi-billion-dollar decisions. We also provide training to improve our client’s ability to quantify anything, build probabilistic models, and not only make better decisions but make better decision-makers. For more information, explore the rest of the website or contact us at info@hubbardresearch.com.
by Joey Beachum | Jun 29, 2019 | Commercial Real Estate, How To Measure Anything Blogs, News

Overview:
- Quantitative commercial real estate modeling is becoming more widespread, but is still limited in several crucial ways
- You may be measuring variables unlikely to improve the decision while ignoring more critical variables
- Some assessment methods can create more error than they remove
- A sound quantitative model can significantly boost your investment ROI
Quantitative commercial real estate modeling (CRE), once the former province of only the high-end CRE firms on the coasts, has become more widespread – for good reason. CRE is all about making good decisions about investments, after all, and research has repeatedly shown how even a basic statistical algorithm outperforms human judgment<fn>Dawes, R. M., Faust, D., & Meehl, P. E. (n.d.). Statistical Prediction versus Clinical Prediction: Improving What Works. Retrieved from http://meehl.umn.edu/sites/g/files/pua1696/f/155dfm1993_0.pdf</fn><fn>N. Nohria, W. Joyce, and B. Roberson, “What Really Works,” Harvard Business Review, July 2003</fn>.
Statistical modeling in CRE, though, is still limited, for a few different reasons, which we’ll cover below. Many of these limitations actually result in more error (one common misconception is merely having a model improves accuracy, but sadly that’s not the case). Even a few percentage points of error can result in significant losses. Any investor that has suffered from a bad investment knows all too well how that feels. So, through better quantitative modeling, we can decrease the chance of failure.
Here’s how to start.
The Usual Suspects: Common Variables Used Today
Variables are what you’re using to create probability estimates – and, really, any other estimate or calculation. If we can pick the right variables, and figure out the right way to measure them (more on that later), we can build a statistical model that has more accuracy and less error.
Most commercial real estate models – quantitative or otherwise – make use of the same general variables. The CCIM Institute, in its 1Q19 Commercial Real Estate Insights Report, discusses several, including:
- Employment and job growth
- Gross domestic product (GDP)
- Small business activity
- Stock market indexes
- Government bond yields
- Commodity prices
- Small business sentiment and confidence
- Capital spending
Data for these variables is readily available. For example, you can go to CalculatedRiskBlog.com and check out their Weekly Schedule for a list of all upcoming reports, like the Dallas Fed Survey of Manufacturing Activity, or the Durable Goods Orders report from the Census Bureau.
The problem, though, is twofold:
- Not all measurements matter equally, and some don’t matter at all.
- It’s difficult to gain a competitive advantage if you’re using the same data in the same way as everyone else.
Learning How to Measure What Matters in Commercial Real Estate
In How to Measure Anything: Finding the Value of Intangibles in Business, Doug Hubbard explains a key theme of the research and practical experience he and others have amassed over the decades: not everything you can measure matters.
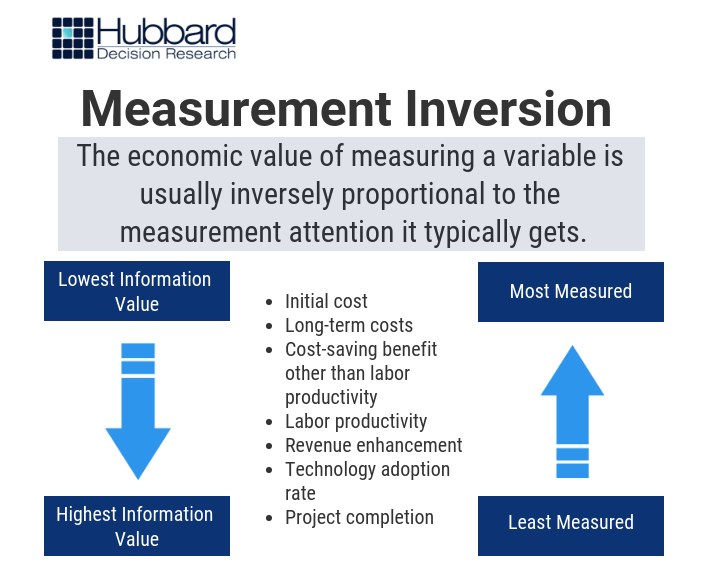
When we say “matters,” we’re basically saying that the variable has predictive power. For example, check out Figure 1. These are cases where the variables our clients were initially measuring had little to no predictive power compared to the variables we found to be more predictive. This is called measurement inversion.
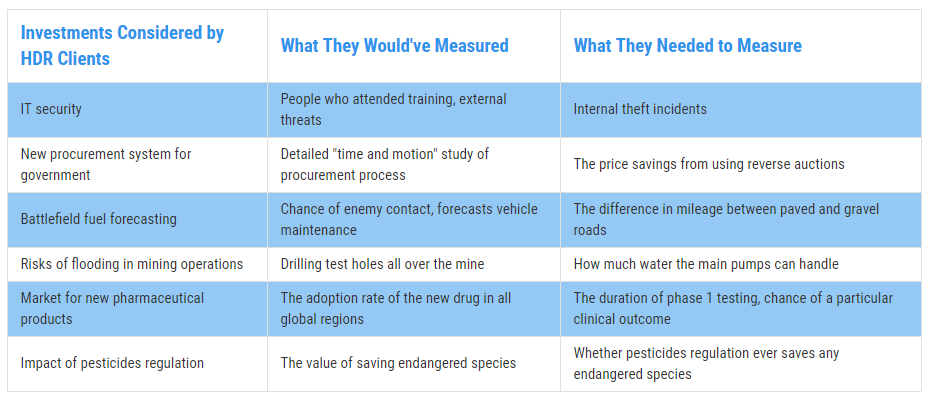 Figure 1: Real Examples of Measurement Inversion
The same principle applies in CRE. Why does measurement inversion exist? There are a few reasons: variables are often chosen based on intuition/conventional wisdom/experience, not statistical analysis or testing; decision-makers often assume that industries are more monolithic than they really are when it comes to data and trends (i.e. all businesses are sufficiently similar that broad data is good enough); intangibles that should be measured are viewed as “impossible” to measure; and/or looking into other, “non-traditional” variables comes with risk that some aren’t willing to take. (See Figure 2 below.)
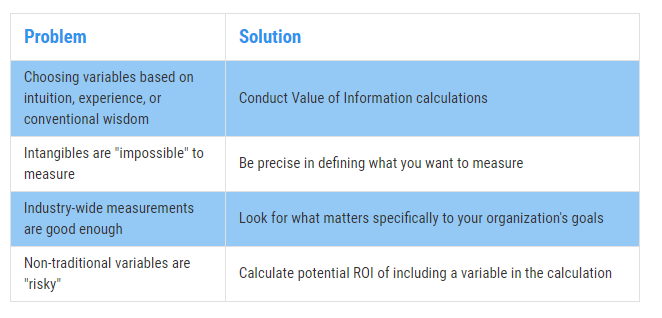 Figure 2: Solving the Measurement Inversion Problem
The best way to begin overcoming measurement inversion is to get precise with what you’re trying to measure. Why, for example, do CRE investors want to know about employment? Because if too many people in a given market don’t have jobs, then that affects vacancy rates for multi-family units and, indirectly, vacancy rates for office space. That’s pretty straightforward.
So, when we’re talking about employment, we’re really trying to measure vacancy rates. Investors really want to know the likelihood that vacancy rates will increase or decrease over a given time period, and by how much. Employment trends can start you down that path, but by itself isn’t not enough. You need more predictive power.
Picking and defining variables is where a well-built CRE quantitative model really shines. You can use data to test variables and tease out not only their predictive power in isolation (through decomposition and regression), but also discover relationships with multi-variate analysis. Then, you can incorporate simulations and start determining probability.
For example, research has shown<fn>Heinig, S., Nanda, A., & Tsolacos, S. (2016). Which Sentiment Indicators Matter? An Analysis of the European Commercial Real Estate Market. ICMA Centre, University of Reading</fn> that “sentiment,” or the overall mood or feeling of investors in a market, isn’t something that should be readily dismissed just because it’s hard to measure in any meaningful way. Traditional ways to measure market sentiment can be dramatically improved by incorporating tools that we’ve used in the past, like Google Trends. (Here’s a tool we use to demonstrate a more predictive “nowcast” of employment using publicly-available Google Trend information.)
To illustrate this, consider the following. We were engaged by a CRE firm located in New York City to develop quantitative models to help them make better recommendations to their clients in a field that is full of complexity and uncertainty. Long story short, they wanted to know something every CRE firm wants to know: what variables matter the most, and how can we measure them?
We conducted research and gathered estimates from CRE professionals involving over 100 variables. By conducting value of information calculations and Monte Carlo simulations, along with using other methods, we came to a conclusion that surprised our client but naturally didn’t surprise us: many of the variables had very little predictive power – and some had far more predictive power than anyone thought.
One of the latter variables wound up reducing uncertainty in price by 46% for up to a year in advance, meaning the firm could more accurately predict price changes – giving them a serious competitive advantage.
Knowing what to measure and what data to gather can give you a competitive advantage as well. However, one common source of data – inputs from subject-matter experts, agents, and analysts – is fraught with error if you’re not careful. Unfortunately, most organizations aren’t.
How to Convert Your Professional Estimates From a Weakness to a Strength
We mentioned earlier how algorithms can outperform human judgment. The reasons are numerous, and we talk about some of them in our free guide, Calibrated Probability Assessments: An Introduction.
The bottom line is that there are plenty of innate cognitive biases that even knowledgeable and experienced professionals fall victim to. These biases introduce potentially disastrous amounts of error that, when left uncorrected, can wreak havoc even with a sophisticated quantitative model. (In The Quants, Scott Patterson’s best-selling chronicle of quantitative wizards who helped engineer the 2008 collapse, the author explains how overly-optimistic, inaccurate, and at-times arrogant subjective estimates undermined the entire system – to disastrous results.)
The biggest threat is overconfidence, and unfortunately, the more experience a subject-matter expert has, the more overconfident he/she tends to be. It’s a catch-22 situation.
You need expert insight, though, so what do you do? First, understand that human judgments are like anything else: variables that need to be properly defined, measured, and incorporated into the model.
Second, these individuals need to be taught how to control for their innate biases and develop more accuracy with making probability assessments. In other words, they need to be calibrated.
Research has shown how calibration training often results in measurable improvements in accuracy and predictive power when it comes to probability assessments from humans. (And, at the end of the day, every decision is informed by probability assessments whether we realize it or not.) Thus, with calibration training, CRE analysts and experts can not only use their experience and wisdom, but quantify it and turn it into a more useful variable. (Click here for more information on Calibration Training.)
Including calibrated estimates can take one of the biggest weaknesses firms face and turn it into a key, valuable strength.
Putting It All Together: Producing an ROI-Boosting Commercial Real Estate Model
How do you overcome this challenge? Unfortunately, there’s no magic button or piece of software that you can buy off the shelf to do it for you. A well-built CRE model, incorporating the right measurements and a few basic statistical concepts based on probabilistic assessments, is what will improve your chances of generating more ROI – and avoiding costly pitfalls that routinely befall other firms.
The good news is that CRE investors don’t need an overly-complicated monster of a model to make better investment decisions. Over the years we’ve taught companies how incorporating just a few basic statistical methods can improve decision-making over what they were doing at the time. Calibrating experts, incorporating probabilities into the equation, and conducting simulations can, just by themselves, create meaningful improvements.
Eventually, a CRE firm should get to the point where it has a custom, fully-developed commercial real estate model built around its specific needs, like the model mentioned previously that we built for our NYC client.
There are a few different ways to get to that point, but the ultimate goal is to be able to deliver actionable insights, like “Investment A is 35% more likely than Investment B at achieving X% ROI over the next six months,” or something to that effect.
It just takes going beyond the usual suspects: ill-fitting variables, uncalibrated human judgment, and doing what everyone else is doing because that’s just how it’s done.
Contact Hubbard Decision Research