by Joey Beachum | May 18, 2019 | How To Measure Anything Blogs, News, The Failure of Risk Management Blogs

Risk management isn’t easy.
At any given time, an organization faces many risks, both known and unknown, minor and critical. Due to limited resources, not all risks can be mitigated. Without an effective risk management process, not all risks can even be identified. Thus, a risk manager’s job is to figure out how to best allocate his or her resources to best protect the organization. The only way to do so in an organized fashion is to have a risk management process – but there’s a big kicker: it has to work.
And as we’ve learned from the past three decades, it’s not a given that a process works as well as it needs to. Often, unfortunately, processes just aren’t very effective, and can actually harm more than they help.
When assessing the performance and effectiveness of your risk management process, it helps if you undertake a rigorous, critical examination of the process, starting with one question: How do I know my methods work?
Before you answer, we need to clarify what this means. By “works” we mean a method that measurably reduces error in estimates, and improves average return on portfolios of decisions compared to expert intuition or an alternative method.
Note that this is not the same as merely perceived benefits. If, for example, estimates of project cost overruns are improved, that should be objectively measurable by comparing original estimates to observed outcomes. Merely using a survey to ask managers their opinions about the benefits of a method won’t do.
Why We Can’t Rely on Our Perception
The reason we can’t rely on the mere perception of effectiveness is that we are all susceptible to a kind of “analysis placebo effect.” That is, research shows that we can increase our confidence at a task while not improving or even getting worse.
For example, it has been shown that just using more data or more “rigor”, even when there is no real measurable improvement, has increased confidence – but not accuracy – in estimating the outcomes of law enforcement interrogations, sporting events, and portfolio returns<fn>DePaulo, B. M., Charlton, K., Cooper, H., Lindsay, J.J., Muhlenbruck, L. “The accuracy-confidence correlation in the detection of deception” Personality and Social Psychology Review, 1(4) pp 346-357, 1997)</fn>.
Merely having a system also doesn’t guarantee effectiveness or improvement. In one study in Harvard Business Review, the authors found that an analysis of over 200 popular management tools and processes had a surprising result: “Most of the management tools and techniques we studied had no direct causal relationship to superior business performance.”<fn>Kassin, S.M., Fong, C.T. “I’m innocent!: Effect of training on judgments of truth and deception in the interrogation room” Law and Human Behavior, 23 pp 499-516, 1999)</fn>
Throw in a myriad of reasons why humans are naturally bad at assessing probability and one can see that any risk management system predicated on subjective, uncalibrated human assessment is, by itself, inherently ineffective at best and dangerous at worst.
It makes sense, then, that if your risk management system fits the above (e.g. it has risk matrices, heat maps, and other pseudo-quantitative, subjective “measurement” systems), it may not be working nearly well as you want.
To be sure, you have to be able to measure how well your risk management system is measuring risk.
Measuring How You Make Measurements
So, how can we measure real improvements? Ideally, there would be some big survey been conducted which tracked multiple organizations over a long period of time which showed that some methods are measurably outperforming others. Did 50 companies using one method over a 10-year period actually have fewer big loss events than another 50 companies using another method over the same period? Or were returns on portfolios of investments improved for the first group compared to the second group? Or were events at least predicted better?
Large scale research like that is rare. But there is a lot of research on individual components of methods, if not the entire methodology. Components include the elicitation of inputs, controls for various errors, use of historical data, specific quantitative procedures, and so on. What does the research say about each of the parts of your method? Also, is there research that shows that these components make estimates or outcomes worse?
Let’s look at the most direct answer to how you can measure your improvements: having a quantitative model. Over 60 years ago, psychologist Paul Meehl studied how doctors and other clinicians made predictions in the form of patient prognoses and found something that was, for the time (and still today) very startling: statistical methods were consistently superior to the clinical judgments rendered by medical experts.<fn>N. Nohria, W. Joyce, and B. Roberson, “What Really Works,” Harvard Business Review, July 2003</fn> In 1989, another paper further solidified the notion that quantitative models – in this study, represented by actuarial science – outperform experts<fn>P.E. Meehl, Clinical Versus Statistical Prediction: A Theoretical Analysis and a Review of the Evidence. (Minneapolis, University of Minnesota Press, 1958)</fn>.
Calibrating experts so they can assess probabilities with more accuracy and (justifiable) confidence has also been shown to measurably improve the performance of a risk management system<fn>R.M. Dawes, D. Faust, and P.E. Meehl, “Clinical Versus Actuarial Judgment,” Science, 243(4899) (1989): 1668-1674</fn>. Calibration corrects for innate human biases and works for about 85% of the population. The results are quantifiable, as evidenced by the image below compiled from calibrating nearly 1,500 individuals over the past 20 years (Figure 1):
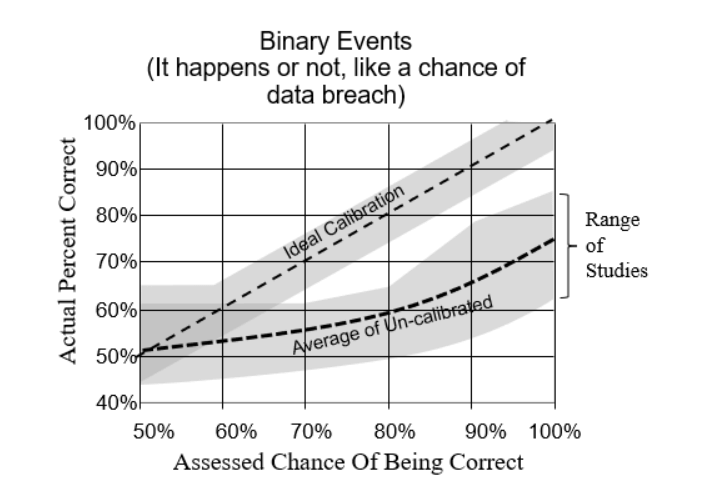
Figure 1: Difference Between Calibrated and Uncalibrated Assessments
Other tools, such as Monte Carlo simulations and Bayesian methods, have also been shown to measurably improve the performance of a quantitative model. So, as we mentioned above, even if you don’t have exhaustive data to verify the effectiveness of the model in whole, you can still test the effectiveness of each individual component.
The bottom line: If you can’t quantitatively and scientifically test the performance and validity of your risk management process, then it probably is causing more error – and risk – than it’s reducing.
This research has already been done and the results are conclusive. So, the only other question is why not get started on improvements now?
by Douglas Hubbard | Feb 24, 2010 | General Topics, How To Measure Anything Blogs, News, The Failure of Risk Management Blogs
I came across more interesting research about possible “placebo effects” in decision making. According to the two studies cited below, receiving formal training in lie detection (e.g. so that law enforcement officers are more likely to detect a untruthful statement by a suspect) has a curious effect. The training greatly increases confidence of the experts in their own judgments even though it may decrease their performance at detecting lies. Such placebo effects were a central topic of The Failure of Risk Management. I’m including this in the second edition of How to Measure Anything as another example of how some methods (like formal training) may seem to work and increase confidence of the users but, in reality, don’t work at all.
- DePaulo, B. M., Charlton, K., Cooper, H., Lindsay, J.J., Muhlenbruck, L. “The accuracy-confidence correlation in the detection of deception” Personality and Social Psychology Review, 1(4) pp 346-357, 1997
- Kassin, S.M., Fong, C.T. “I’m innocent!: Effect of training on judgments of truth and deception in the interrogation room” Law and Human Behavior, 23 pp 499-516, 1999
Thanks to my colleague Michael Gordon-Smith in Australia for sending me these citations.
Doug Hubbard
by Douglas Hubbard | Feb 20, 2010 | News, The Failure of Risk Management Blogs
I get many emails about the validity of Risk Maps, Risk Scores and Risk Matrices in risk analysis. I know there are a lot of passionate proponents of these methods (and many heavily-invested vendors) but there is still no evidence that such methods improve forecasts or decisions.
Read my skeptical look at many risk analysis methods in the OR/MS Today and Analytics articles (See the Articles page). I compiled quite a lot of research in these articles and even more in my book that should lead any manager to be suspicious about whether the perceived effectiveness of these methods is real or imagined.
I’ve updated the upcoming second edition of How to Measure Anything with even more research in that vein. Stay tuned and post your comments.
Doug Hubbard
by Douglas Hubbard | Sep 11, 2009 | News, The Failure of Risk Management Blogs
Originally posted at http://www.howtomeasureanything.com, on Friday, September 11, 2009 9:02:59 AM, by Unknown.
“On page 47 of HTFRM Mr. Hubbard refers to the website for viewing an evolving taxonomy of major risks.
I am having trouble locating it, am I missing something?”
Not at all. We haven’t had much discussion about it so it was evolving very slowly.
But this is where we wanted to posts those risks. I wanted to keep a running tab of major risks and have discussions about prioritizing them. Eventually, this would be part of a growing GPM.
The important thing is to have something that is not static and currently, there really is no “real time” list of risks. Part of the problem in risk management is that it seems to be about the last big disaster. After 9/11, RM was about terrorism, after Katrina it was about natural disasters, and after 2008 it was about financial crisis.
The news gives us some list of risks but those risks are not exactly chosen for their validity as real risks. Still, it gives us a starting point. While we don’t want to merely react to the latest unique catastrophe, we need to know that the catastrophe teaches us what is possible. And if we think about it, it can be extrapolated to other possibilities.
There are several things that concern me for the next few decades. But the theme I would like to start with are a category of natural disasters so large that a comprehensive response by emergency services is impossible. Below I list two to start with. While these are major national and global catastrophes, they should be considered from the point of view of individuals and organizations.
1) A major earthquake on the west coast of the US. The largest earthquake scenarios are many times larger than we would have the resources to respond to. Individual organizations should consider how to relocate operations in that area, arrange transportation of staff, and ensure continuity.
2) The one in a few-century tsunami happening slightly more often. Rising oceans from global warming (regardless of what anyone thinks the cause is, the rising oceans are a fact) will have two impacts that compound in a potentially disastrous manner. Slightly heavier loads on the ocean floor as the sea level rises will have seismic effects that can not be confidently modeled by geologists. The slightly deeper water has a non-linear effect on tsunami size for a given earthquake. A large wave from oceans just a few centimeters higher will be able to travel much further inland. Combine this with the fact that current population density on all the oceans shores is much higher than it was during the last once-in-200 years tsunami. As devastating as it was (100,000+ killed) the 2004 tsunami was not near a major metropolitan population like the west coast of the US. It is just as likely that the next big one will near the US as anywhere else.
Any more ideas out there? Let’s not just post the latest big concern on the news, but situations that are so bad that it would be hard to think through the consequences. If disasters like those two above happened – which is quite possible in the span of the current generation – organizations and individuals couldn’t possibly count on assistance from authorities. Either of these events could be many times worse than Katrina. And California, a major part of the US economy, is particularly vulnerable to these scenarios. Events like these seem like science fiction to most people who haven’t actually lived through something like that. As I mention in the book, the mere lack of such events recently doesn’t change the risk, but it does increase our complacency.
Thanks for helping to get this started,
Doug Hubbard