
Overview:
- The most common reason organizations fail at innovating might not be what you think
- Defining what innovation means to an organization is critical for success
- Even the best-defined innovation initiatives fail if they aren’t properly measured
Innovation has captured the imagination of business leaders everywhere. Everyone wants to create that ground-breaking, disruptive product or service that turns the industry on its head. Or, at the very least, they want to move toward changing anything – paradigms, processes, markets, you name it – that will take the organization to that next level.
Unfortunately, many innovation initiatives fail, a failure being an outcome which is disproportionately smaller than expectations, allocated resources, or both. They happen quite commonly, and business literature is rife with reasons why, ranging from not having ideas that are “good” to not having the right people, enough budget, or an accepting culture.
The main reason an innovation initiative fails, however, is more fundamental: companies aren’t doing a good enough job defining what innovation actually means and then measuring it.
The Innovation Definition Problem
Decision-makers that this very moment are spending a staggeringly-high percentage of their revenue trying to innovate often don’t have a firm definition of what innovation means – and this isn’t just academic.
Innovation is a vague, mostly meaningless term that obscures what you’re really trying to accomplish. It can mean almost anything. Everyone has a definition; here’s 15 of them.
What we’ve found when faced with these terms (and there are a lot of them) is that either the decision-makers know what they want to accomplish, but they don’t know how to measure it, or they think they know what they want to accomplish, but they’re measuring the wrong things (or even pursuing the wrong goal).
So, how do you define the problem? When organizations want to innovate, they’re largely looking to do something that they couldn’t previously do, for the purpose of taking the company to a level it couldn’t previously reach.
How they achieve this is largely a function of two things: impact and timeliness. The earlier a company undertakes an initiative, and the more impact that initiative has, the more innovative a company will be, as shown by the Innovation Time/Impact Square in figure 1:
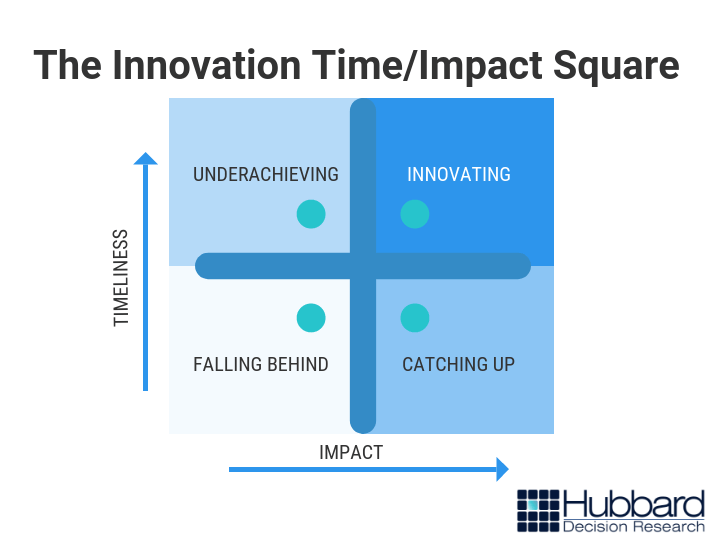
Figure 1 – Innovation Time/Impact Square
In our experience, the companies that find the greatest success compared to their peers come up with better ideas – impact – and do so usually before anyone else – timeliness. If your products or services are producing a lot of return, but you are behind the curve, you’re mainly just catching up by implementing best practices. If you’re getting there first, but your concepts aren’t particularly high-value, then you’re underachieving given your abilities. And if your concepts are low value and based only on what others have done before you, you’re falling behind.
Any of the three states of being may be acceptable, but none are examples of innovation.
What does “impact” mean? One way to define it is to select an objective – revenue growth, higher stock price, more sales, greater market share, or some other desired outcome – and determine the growth target.
Of course, no organization is going to spend a significant portion of their budget on merely adding a percent or two to their growth, not if they can help it. The allure of innovation is substantial, paradigm-changing growth.
What that growth looks like specifically depends on the firm, but the reality is simple: spending significant resources on innovation – a difficult and costly process – needs to be worth it.
“Timeliness” can mean a variety of things as well. Increasing the quantity of product concepts produced over a given period of time is one definition. Identifying new trends before anyone else is another. Focusing on speeding up the pace at which you create does have value in and of itself, but investing too much in accomplishing this goal can result in lower overall return.
Framing innovation in this way gives you the basis to make better decisions on anything from how much to increase the R&D budget to who you need to hire, what technology you need to acquire, or what you need to do to improve the quality of the ideas your organization creates.
Once you’ve defined what innovation means to your organization, you then have to measure it.
The Innovation Measurement Problem
The innovation measurement problem is simple: companies, by and large, don’t know how to measure this concept. In practice, this means most firms can’t:
- Evaluate how “good” they are at innovation, whatever that means
- Figure out what it takes to get “better” at innovation, whatever that looks like
- Determine the cost of doing those things to get “better” and forecasting ROI
The first major attempt to accomplish the first task came in 1976, when Michael Kirton produced a paper identifying the two types of creators: adaptors (those who make existing processes better) and innovators (those who do something different). From this effort came the Kirton Adaption-Innovation (KAI) Inventory, which basically provides a person with where he or she falls on this adaption-innovation continuum.
The effort is a noble one, but we don’t have any sense of objective value. Are people at the Innovation end of the scale better at growing a company than the ones at the other end, and if so, by how much?
These kinds of problems aren’t specific to just the KAI inventory; they’re found in almost every attempt to quantify the processes, impacts, and probability of innovation initiatives.
For example, some organizations also use what academics call semi-quantitative measures (we call them pseudo-quantitative ones) like the “innovation Balanced Scorecard” promoted in 2015, and the “Innovation Audit Scorecard,” promoted in 2005. The flaws of these particular methods are explained in How to Measure Anything; they include the following:
- Ranges of values on scorecards are largely arbitrary;
- Weighting scores is also arbitrary (i.e. how do you know this component, weighted at 15%, is twice as important as one weighted 7.5% Are those individual values accurate?);
- Estimates are usually subjective and uncalibrated, even from experts;
- It’s impossible to perform meaningful mathematical operations with ordinal scales (i.e. is something that is a 4 really twice as effective as something that’s a 2?)
- They don’t incorporate probabilities of outcomes; and
- Using one gives you the illusion of improving decision-making, even though doing so may actually introduce error (a concept called the analysis placebo)
McKinsey, to its credit, promotes two quantitative metrics to evaluate effectiveness of R&D expenditures (ratio of R&D spending to new product sales and product-to-margin conversion rate), but even this approach doesn’t speak to whether or not the innovation problem lies within R&D – or if focusing on improving these two metrics is the best action to take.
Plus, R&D is only one way a company can innovate, per how we defined the concept above, and it doesn’t exist in a vacuum; it is accompanied by a host of other factors and strategies.
There’s a bigger problem, though, with measuring innovation: even if you come up with “good” metrics, no one tells you which “good” metrics have the most predictive power for your organization. In other words, each variable, each measurement, each bit of information you gather has a certain value. The vast majority of the time, organizations have no idea what the value of these pieces of information are – which leads to them measuring what is easy and simple and intuitive rather than what should be measured.
For example, one common metric that is bandied about is the number of patents created in a certain period of time (i.e. a quarter, or a year). Refer back to the Innovation Time/Impact Square above. More patents increase the chance that you’ll get there first, right? Maybe – but that may not make you more innovative. What if you modeled your creative process and actually estimated the market potential of an idea before you developed and patented it and found that your ideas, as it turns out, have consistently low market potential? Then your problem isn’t “How do we create more ideas?”; it’s “How do we create better ideas?”
It doesn’t matter if you know you need to create ideas that are more timely and more impactful if you can’t measure either. You won’t be able to make the best decisions, which will keep your organization out of the rarified air of the innovators.
The bottom line: focusing on defining innovation for your firm and creating better measurements based on those definitions is the only proven way to improve innovation.

 cash flow statement, and generating thousands of simulations. Using our Excel-based risk-return analysis (RRA) template, this process can take anywhere from 30 minutes to 6 hours, depending on the complexity of the problem and my familiarity with the topic.
