by Robert Weant | Nov 20, 2023 | Facilitating Calibrated Estimates
In a previous article, we measured how calibrated Chat GPT 4 was at providing a 90% confidence interval. During the experiment, after explaining what is meant by a 90% confidence interval, Chat GPT would provide a stated 90% interval that would only contain the actual answer 60% of the time. For comparison, on average humans’ performance is at 52% (This metric is slightly updated due to a larger sample size since the previous article was written). Thankfully, providing calibrated probability estimates is not some innate talent determined by genetics nor a skill bestowed upon people by the Gods of statistics. It is a skill that can be taught and learned.
Calibration Training: Understanding One’s Own Uncertainty
HDR has built upon decades of research in this area through the works of Nobel Prize winner Daniel Kahneman and political scientist Phillip Tetlock, to build the most comprehensive online calibration training platform available. Through a series of tests and training videos, humans learn how under or overconfident they are when giving probabilistic estimates and strategies that help them give more accurate probability assessments. When used correctly these strategies help humans translate their uncertainty into quantitative terms.
We put Chat GPT 4 through a similar process. Using 62 events that occurred after its data cut-off point, we went through several rounds of forecasting with Chat GPT where we asked it to provide 90% confidence interval estimates on topics such as sports, economics, politics, and pop culture. We then followed up by teaching it the same subjective forecasting strategies we teach humans in our training.
Below are the results of teaching these methods to humans and Chat GPT and recording their performance. For humans, these strategies were taught sequentially in which humans received a series of 6 tests and had their performance recorded. For Chat GPT, two sessions were created in which the temperature was set to 0 to decrease “creativity” in responses or as some might describe it “noise”. One was given a simple explanation of 90% confidence intervals and asked to forecast 62 events, the other was asked to apply the strategies mentioned above when forecasting the same 62 events.
|
Initial Performance |
After Training and Strategies |
| Humans |
52% (10K intervals, 1001 humans) |
78% (52K intervals, 1001 humans) |
| Chat GPT 4 |
64.5% (62 intervals, 1 session) |
58% (62 intervals, 1 session) |
When it comes to humans, teaching these strategies significantly improves calibration. While still not perfectly calibrated to a 90% level, after going through calibration training their overconfidence is greatly diminished. It is worth noting, that the average for humans is brought down by outliers. Essentially individuals, whom we suspect based on their recorded time to completion, quickly answer questions without reading them.

Chat GPT on the other hand, struggles to use these strategies effectively and gives slightly worse estimates. A closer examination reveals that the version that was taught the strategies starts with a much more narrow range, then sequentially widens the range, by small amounts on both ends. It did not discriminate between different questions and would modify its range by similar amounts for each forecast. The result is a range with a width closer to that of the other session. Fortunately, there is another way of calibrating Chat GPT.
Calibration Training Hard Calculated Adjustment
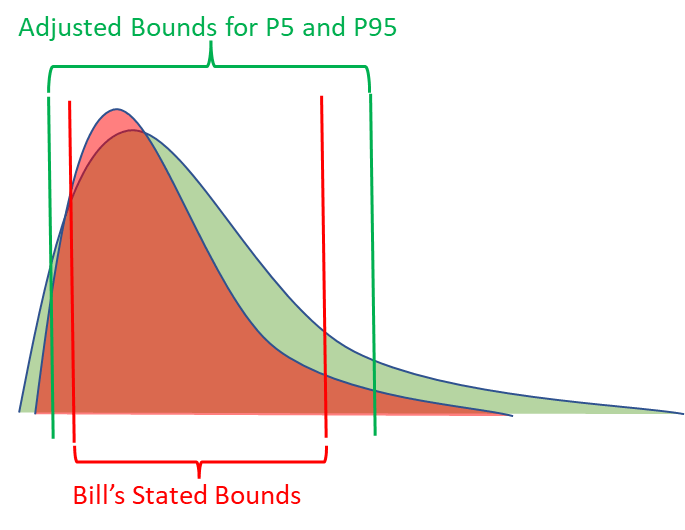
Anytime a human goes through calibration training, we know how to get calibrated 90% confidence intervals from them, even if they perform poorly during the calibration process. If Bill consistently gets 80% of the answers between his stated bounds, we know what metrics should be applied to his stated bounds in order to turn them into calibrated P5s and P95s. In other words, we know how to adjust for Bill’s overconfidence.
The exact same process can be applied to Chat GPT or other language models. To test this, we divided the set of 62 forecasts into a train and test set, with 31 forecasts in each. We calculated what the average adjustment would need to be for both the lower and upper bounds to be 90% calibrated for only the training set of questions. Then applied these adjustments to the test set of questions.
|
Initial Stated Bounds |
After Applying Adjustment |
| Train Set |
68% (31 intervals) |
90.3% |
| Test Set |
61% (31 intervals) |
87.1% |
(Adjustments are calculated by normalizing the data on a scale of 0 to 1 with 0 = stated LB and 1 = stated UB)
This process was repeated 1000 times with different random samplings for the train and test data sets. After applying the adjustments developed from the training data sets, the average percent correct for the test data set bounds was 89.3%, which is nearly perfectly calibrated.
Practical Applications
Now that we have a method to obtain calibrated 90% confidence intervals from Chat GPT, can we use it to replace analysts’ subjective judgment when making decisions? Not exactly. The subjective confidence intervals given by Chat GPT should be viewed as initial baseline estimates. While calibrated to a 90% level, the intervals are much wider than what we would expect experts to provide. The information value Chat GPT has on a certain forecast is less than what we would expect from an expert on that topic.
For example, one of the forecasting questions was estimating Microsoft’s total 2022 revenue. After applying the adjustments to calibrate it, the output was a very wide range of $87 – 369 billion. I’m not a financial analyst with a focus on the tech industry, but I imagine obtaining a similar calibrated subjective forecast from financial analysts in January 2022 (Chat GPT’s data cut-off date) would result in a much more narrow range.
|
Adjusted LB (P5) |
Adjusted UB (P95) |
Actual Answer |
| Microsoft Total 2022 Revenue |
$86.7 Billion |
$379.2 Billion |
$198.3 Billion |
The advantage Chat GPT and other generative AIs have is their speed and cost. In many models HDR builds for clients to help them make multi-million or even billion-dollar decisions, we’ll have a list of hundreds of variables that our client knows have an impact on the decision, but they are unsure how to quantitatively define them or who they should get to estimate them. It can take weeks to obtain estimates from experts or to collect data from other departments, while Chat GPT will take less than 5 minutes.
The key usefulness of starting with a calibrated baseline estimate is the implications of calculating the expected value of perfect information (EVPI). In every model we build, we calculate what the EVPI is for every variable. The EVPI is a monetized sensitivity analysis that computes how valuable it would be to eliminate uncertainty for a certain variable. It allows the analysts to pinpoint exactly how much effort they should spend analyzing certain variables. But this only works if there are initial calibrated estimates in the model.
In a follow-up article, I will be reviewing how HDR is incorporating Chat GPT in its decision models. This will include how we are utilizing it to estimate 90% confidence intervals within the model, how it can be prompted to build cashflow statements, and the implications of auto-generated EVPIs for follow-up analysis.
NOTE: Open AI released a major update for Chat GPT on November 6th. During this update, the data cut-off date was changed to April 2023. All interactions with Chat GPT mentioned in this article occurred in September and October of this year when the data-cutoff point was still January 2022 for Chat GPT 4.

by Robert Weant | Sep 12, 2023 | Facilitating Calibrated Estimates
“It’s not what we don’t know that hurts, it’s what we know for sure that just ain’t so.”
The quote above is often attributed to Mark Twain. Ironically, the authorship of this quote being somewhat uncertain, beautifully illustrates the very point it makes. Nevertheless, the quote accurately describes the dangers of humans being overconfident. Put into quantitative terms, being overconfident is assigning higher probabilities to items than what should be the case. For example, if I’m asked to give a 90% confidence interval for 100 questions, the correct answers should be between my stated bounds 90% of the time. If it is less than 90%, I’m overconfident, and if it’s more than 90% I’m underconfident.
There have been many peer-reviewed papers on this topic that reveal humans, regardless of field or expertise, are broadly overconfident in providing probabilistic estimates. Data collected by HDR on calibration performance supports this conclusion. When participants prior to any sort of training were asked to provide 90% confidence intervals for a set of questions, on average, only 55% of answers fell within their stated ranges.
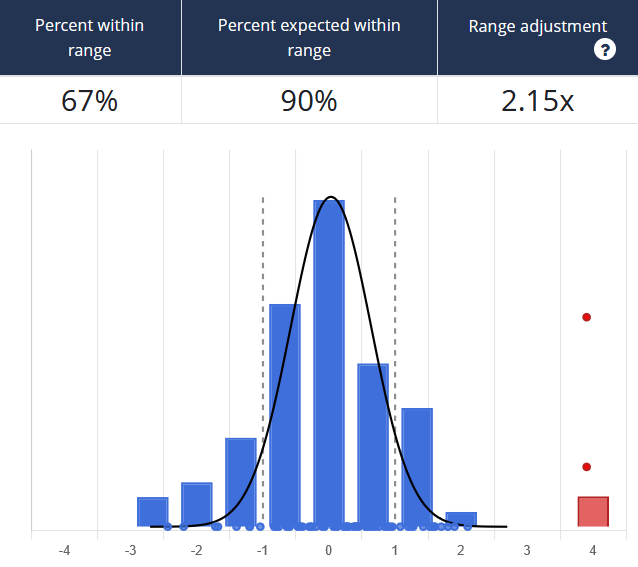
An example from our Calibration Training shows a group only getting 67% of questions within their stated ranges. Here the estimators’ lower and upper bound responses are normalized as values between -1 and 1. If the correct answer is outside their range, it falls above or below -1 and 1 on the graph. The red dots represent outliers where the response wasn’t just wrong but considerably far off.
 So how does AI stack up against humans here? In order to compare the performance of AI relative to human estimators, we asked 18 instances of ChatGPT 4 to provide 90% confidence interval estimates for a set of 20 questions on topics of sports, economics, and other metrics that are easily verifiable. This resulted in a total of 360 unique estimates. This differed from the trivia questions we use when calibrating human experts as ChatGPT 4 has access to all that information. Remember, the goal of calibration is not to answer questions correctly but to accurately reflect one’s own uncertainty. Trivia questions are used in our training because immediate feedback can be provided to individuals, which is essential in improving performance. To replicate this effect with AI, we limited the questions to ones that had actual answers manifest sometime between September 2021 (the data cutoff point for ChatGPT) and August 2023. An example of such a question is “How much will the top-grossing film earn internationally at the box office in 2022?”. This way we could evaluate whether the actual value (when analyzed retrospectively) fell within the estimated bounds by ChatGPT 4.
The results indicated below show the average calibration of the ChatGPT instance to be 60.28%, well below the 90% level to be considered calibrated. Interestingly, this is just slightly better than the average for humans. If ranked amongst humans, ChatGPT 4’s performance would rank at the 60th percentile from our sample.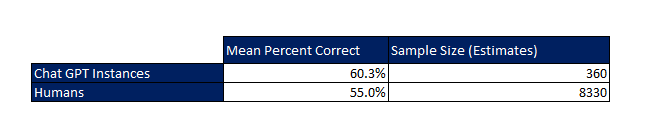
If we applied this average level of human overconfidence toward hypothetical real-world cases, we would drastically underestimate the likelihood of extreme scenarios. For example, if a cybersecurity expert estimated financial losses to be between $10 – $50 million when a data breach occurs, they are stating there is only a 5% chance of losing more than $50 million. However, if they are as overconfident as the average human, the actual probability would be closer to 22.5%.
As far as humans go, there is some good news. Being accurately calibrated is not some innate talent determined by genetics, but a skill that can be taught and improved upon. Papers and studies provide conclusive evidence that humans can greatly improve their ability to give probabilistic estimates. HDR built upon these studies and developed online training that is specifically designed to improve individual human calibration for probabilistic estimates. Before training the average calibration level was 55% when trying to provide a 90% confidence interval for an uncertain quantity. By the end of training, this improved to 85%. Humans were able to better understand their own uncertainty and translate it into useful quantitative terms.
As we begin to rely more on language models, it is essential that we understand the uncertainty in the output they produce. In a follow-up and more in-depth study, HDR will be testing to see whether we can train ChatGPT and other language models to assess probabilistic estimates more accurately, and not fall victim to overconfidence or as Twain might put it “thinking what we know for sure that just ain’t so.”
Find out more about our state-of-the-art Calibration Training here
by Douglas Hubbard | Jun 8, 2009 | Facilitating Calibrated Estimates, How To Measure Anything Blogs, News
Originally posted on http://www.howtomeasureanything.com/forums/ on Wednesday, July 08, 2009 2:46:05 PM by
“Hi Doug,
I want to share an observation a V.P. made after doing the 10 pass fail questions. If one was to input 50% confidence to all the questions and randomly selected T/F they would be correct 1/2 the time the difference would be 2.5.
The scoring would indicate that that person was probably overconfident. Can you help here ?.
I am considering making the difference between the overall series of answers (as a decimal) and the Correct answers(as a decimal) as needing to be greater than 2.5 for someone to be probably overconfident.
please advise
Thaks in advance – Hugh”
Yes, that is a way to “game the system” and the simple scoring method I show would indicate the person was well calibrated (but not very informed about the topic of the questions). It is also possible to game the 90% CI questions by simply creating absurdly large ranges for 90% of the questions and ranges we know to be wrong for 10% of them. That way, they would always get 90% of the answers within their ranges.
If the test-takers were, say, students, who simply wanted to appear calibrated for the purpose of a grade, then I would not be surprised if they tried to game the system this way. But we assume that most people who want to get calibrated realize they are developing a skill they will need to apply in the real world. In such cases they know they really aren’t helping themselves by doing anything other than putting their best calibrated estimates on each individual question.
However, there are also ways to counter system-gaming even in situations where the test taker has no motivation whatsoever to actually learn how to apply probabilities realistically. In the next edition of How to Measure Anything I will discuss methods like the “Brier Score” which would penalize anyone who simply flipped a coin on each true/false question and answered them all as 50% confident. In a Brier Score, the test taker would have gotten a higher score if they put higher probabilities on questions they thought they had a good chance of getting right. Simply flipping a coin to answer all the questions on a T/F test and calling them each 50% confident produces a Brier score of zero.
Thanks for your interest,
Doug Hubbard
by Douglas Hubbard | Apr 30, 2009 | Facilitating Calibrated Estimates, How To Measure Anything Blogs, News
Originally posted on http://www.howtomeasureanything.com/forums/ on Thursday, April 30, 2009 6:20:57 AM.
“Hi Douglas,
I want to thank you for your work in this area .Using the information in your book I used Minitab 15 and created an attribute agreement analysis plot. The master has 10 correct and I then plotted 9,8,7,6,5,4,3,2,1,0. From that I can see the overconfidence limits you refer to in the book. Based on the graph there does not appear to be an ability to state if someone is under-confident. Do you agree?
Can you assist me in the origin of the second portion of the test where you use the figure of -2.5 as part of the calculation in under-confidence?
I want to use the questionnaire as part of Black Belt training for development. I anticipate that someone will ask how the limits are generated and would like to be prepared.
Thanks in advance – Hugh”
The figure of 2.5 is based on an average of how confidently people answer the questions. We use a binomial distribution to work out the probability of just being unlucky when you answer. For example, if you are well-calibrated, and you answer an average of 85% confidence (expecting to get 8.5 out of 10 correct), then there is about a 5% chance of getting 6 or less correct (cumulative). In other words, at that level is is more likely that you were not just unlikely, but actually overconfident.
I took a full distribution of how people answer these questions. Some say they are an average of 70% confident, some say 90%, and so on. Each one has a different level for which there is a 5% chance that the person was just unlucky as opposed to overconfident. But given the average of how most people answer these questions, having a difference of larger than 2.5 out of 10 between the expected and actual means that there is generally less than a 5% chance a calibrated person would just be unlucky.
It’s a rule of thumb. A larger number of questions and a specific set of answered probabilities would allow us to compute this more accurately for an individual.
Thanks,
Doug
by Douglas Hubbard | Mar 9, 2009 | Facilitating Calibrated Estimates, How To Measure Anything Blogs, News
Originally posted on http://www.howtomeasureanything.com/forums/ on Monday, March 09, 2009 9:14:11 AM.
“I just read your book and found it fascinating. Thanks.
On calibrated estimates, once experts are calibrated, do they stay calibrated?
Or do you repeat every time that you are beginning a project or making an estimate.
I’m just thinking in a corporate setting – do you just do it once for a group of people that you may want estimates for or would you do it before each project. Do it annually?
What has been your experience on how long people stay calibrated?
Thanks,
Praveen”
by Douglas Hubbard | Feb 16, 2009 | Facilitating Calibrated Estimates, How To Measure Anything Blogs, News
Originally posted on http://www.howtomeasureanything.com/forums/ on Monday, February 16, 2009 11:32:17 AM.
“I am looking for some material (articles or books) on the subject of Calibration. I want to be expert in Calibration.
Thakur”
I certainly support your goal for becoming and expert in this topic. It is a well-studied topic but is still far too obscure in practical applications. Beyond my book, the most important sources are the purely academic literature…which I would definitely recommend for anyone who wants to be an expert. My next book The Failure of Risk Management, will cover this topic with a slightly different emphasis and, in some cases, in more detail. In both books, I resort to several academic studies, including the following.
A key source is Judgment Under Uncertainty: Heuristics and Biases, Cambridge University Press, 1982. It is a compilation of several research papers on the topic. You can buy this book on Amazon.
Here are several more articles:
A.H. Murphy and R. L. Winker, ‘‘Can Weather Forecasters Formulate Reliable Probability Forecasts of Precipitation and Temperature?,’’ National Weather Digest 2, 1977, 2–9.
D. Kahneman and A. Tversky, ‘‘Subjective Probability: A Judgment of Representativeness,’’ Cognitive Psychology 3, 1972, 430–454.
G.S. Tune, ‘‘Response Preferences: A Review of Some Relevant Literature,’’ Psychological Bulletin 61, 1964, 286–302.
E. Johnson, ‘‘Framing, Probability Distortions and Insurance Decisions,’’ Journal of Risk and Uncertainty 7, 1993, 35.
D. Kahneman and A. Tversky, ‘‘Subjective Probability: A Judgment of Representativeness,’’ Cognitive Psychology 4, 1972, 430–454.
D. Kahneman and A. Tversky, ‘‘On the Psychology of Prediction,’’ Psychological Review 80, 1973, 237–251.
A. Tversky and D. Kahneman, ‘‘The Belief in the ‘Law of Small Numbers,’’’ Psychological Bulletin, 1971.
A. Koriat, S. Lichtenstein, and B. Fischhoff, ‘‘Reasons for Confidence,’’ Journal of Experimental Psychology: Human Learning and Memory 6, 1980, 107–118

