Pop quiz: which of the following statements about decisions do you agree with:
- You need at least thirty data points to get a statistically significant result.
- One data point tells you nothing.
- In a business decision, the monetary value of data is more important than its statistical significance.
- If you know almost nothing, almost anything will tell you something.
Believing the first two statements will limit your effectiveness in using statistics in a business decision. The second two statements capture one of the important points in Applied Information Economics: small data is often very useful in decision making when there is great uncertainty. This article presents three examples of how a sample of just five data points can tip the scales in a business decision.
Example 1: length of employees’ commutes.
Decision: management is deciding on a proposal and wants to measure the benefits of the proposed organizational transformation.
In their business case, the variable “time spent commuting” has come back with a high information value. If the average time spent commuting is more than 20 minutes, then the decision has an acceptable ROI profile. They randomly select five people and ask them their commute times.
Data collected:
| Taka | 25 minutes |
| Bob | 20 minutes |
| Frank | 35 minutes |
| Asim | 55 minutes |
| Jane | 35 minutes |
Using our “rule of five” the 90% confidence interval for the median of our population of employees is 20-55 minutes. Our 90% confidence interval for the mean of the population is 21.2 to 46.8 minutes. This was calculated using our Small Sample calculator found here.
[Wonk alert!] In the small sample calculator, we are using a simplifying assumption that the distribution is normally distributed, which obviously is not always the case. Even in the example given, it is unlikely that the distribution of drive times is normally distributed, but this still provides a reasonable approximation for a 90% range estimate for mean drive time.
Example 2: minor league, major decision
Decision: a baseball team manager needs to decide if he should send a player back to the minor leagues.
The manager has brought a player up from the minor leagues, and the player has had 5 at bats and zero hits. The manager has a minimum required batting average of .215 for players in their first year in the majors. Are five at bats without a hit enough data to be 90% confident the player should be sent back to the minor leagues?
For this type of data we would use an inverse beta distribution to calculate the 90th percentile of the distribution of batting averages. [Nerd panic! Note this isn’t quite the same as a 90% confidence interval which would be the range from the 5th percentile to the 95th percentile] Entering an alpha of 1 (no hits) and a beta of 6 (5 misses) returns a 90th percentile of .319. The manager can be 90% confident that the player’s batting average is below .319 but cannot be 90% confident that the player’s batting average will be less than .215. However, to get there requires just 4 more at bats with no hits. No pressure young man!
Example 3: Big Dig on a small scale
Decision: The Executive Team wants to improve project management by being better able to assess a 90% confidence range of development time based on engineers’ initial estimates.
The company has carefully tracked original estimates for five projects and can now compare them to actual duration:
Software Development Time
| Initial Estimate | Actual | |
| Project 1 | 8 weeks | 17 weeks |
| Project 2 | 22 weeks | 42 weeks |
| Project 3 | 4 weeks | 5 weeks |
| Project 4 | 3 weeks | 9 weeks |
| Project 5 | 11 weeks | 11 weeks |
If we want to get a 90% confidence interval for actual development time based on our data, how would we do that? We can start by plotting the 5 points on a scatter chart.
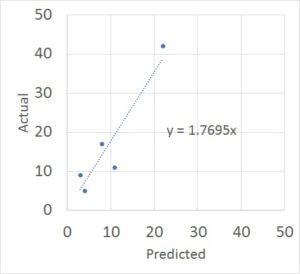
Based on a linear regression of these five points the actual time to completion is 177% of the initial estimate. Next we estimate a 90% confidence interval on the range for actual versus initial estimate. The ratios between the actual and predicted are: 213%, 191%, 125%, 300%, and 100%. Entering these values in the small sample calculator we get a 90% confidence interval for the average of 110% and 261%. So if the initial project estimate is 10 weeks, our best estimate would be 18 weeks and our 90% range would be 11 to 26 weeks.
Conclusion
Collecting data is all about resolving uncertainty. And in our busy work environment, we’re often expected to make the best conclusions in a limited amount of time. However, if we target the right variable we can improve our judgment with just a few data points.
So get out there and do some measurements! And reward yourself with better decisions.
