Misallocation of Vaccines Leads to 75,000 Additional US Deaths…At Least
As we prepare to roll out the vaccine across the United States, we are faced with an unparalleled opportunity. But there is also a danger of squandering the opportunity. States will distinguish themselves by the speed with which they get their populations to herd immunity, and by the degree to which they minimize the number of people who die during the period when the vaccine is provided.
The number of vaccines available per month is outside of your control. Therefore, as a decision maker, the lever for affecting outcomes lies in your decisions about what order (and which of) your citizens get the vaccine. Certain populations should clearly be at the front of the line (e.g. health care workers without SARS COV2 antibodies). But many questions remain: does the benefit of knowing who has antibodies justify the cost of an antibody test? Should you prioritize people more likely to spread COVID (front-line workers) or people more vulnerable to adverse outcomes (comorbid/elderly).
Vaccination Strategies for Minimizing Deaths
How vaccines are distributed can make a huge difference in the duration of economic effects, hospitalizations, and even deaths. Our analysis shows that nationwide an optimized distribution strategy is 90% likely to avoid more than 75,000 deaths over simpler distribution strategies. The same analysis shows that even for a medium sized state, improved vaccination strategies could reduce the duration of the pandemic by two months and could reduce the number of deaths due to COVID infection by more than 1,000 people.
This is accomplished by how we make tradeoffs among three guiding principles:
- Don’t vaccinate people who have already had the infection.
- Vaccinate people who are more likely to infect others.
- Vaccinate vulnerable people (elderly and people with comorbidities are at higher risk of dying.)
There is extensive research indicating likelihood of reinfection is low and that infection with SARS-COV2 confers long term immunity[1][2][3][4]. One might therefore think the lowest hanging fruit would be to prioritize immunizations for the population that does not have antibodies or memory T cells for SARS-COV2. Unfortunately, only 10-20% of those who have had the illness are “visible” as indicated by a confirmed COVID test[5]. The remaining 80-90% of the already immune population is indistinguishable from the people who are not immune. So which tool should you use to reveal who is in this “not immune” population – antibody tests or statistical analysis? The answer to this question is pivotal and will probably vary from county to county and city to city. What is your current strategy to answer this question?
The other pivotal question is whether a strategy will save more lives by focusing on vaccinating socially active [6] or by focusing on vaccinating vulnerable populations? It is relatively straightforward to determine who is in the most vulnerable population (elderly and people with comorbidities) but knowing which broad strategy saves more lives is not as clear.
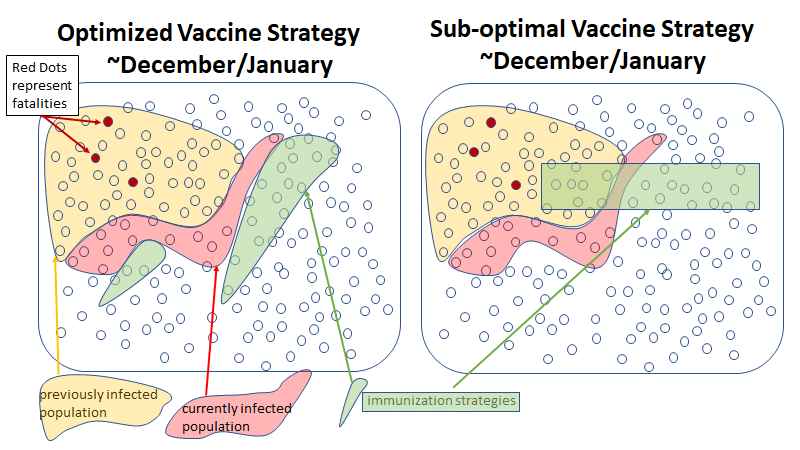
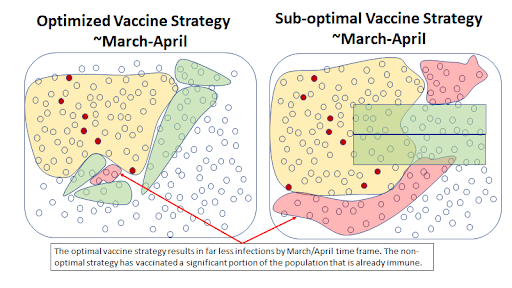
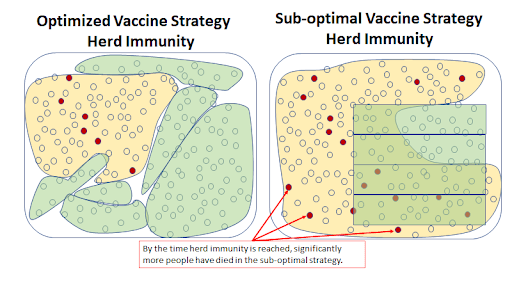
The charts below show how the virus may spread with an optimized strategy vs. a less effective strategy. In the less effective strategy, some vaccines are wasted on individuals who already have antibodies. In addition, the sub-optimal strategy would not attempt to identify recipients for the vaccine as a function of how likely they are to spread the virus to others.


The better strategy minimizes the use of vaccines on people who do not need them and focuses on individuals more likely to spread the virus to others. Because this strategy slows down the rate of spread, it also allows more time to vaccinate the population not already immune.
The costs and benefits are also not limited to directly saving lives. Since the optimal strategy would also end community transmission more quickly, there would be economic benefits as well. For a medium sized state like Wisconsin, economic benefits would run in the billions of dollars (think opening a convention center 45 days before your neighboring states are able to do so). For the same state, the cost of getting the order wrong is a thousand or more (preventable) COVID deaths and a society shut down for 1 month+ longer than need be. As a decision maker for vaccine distribution, you get to decide whether to be seen as the hero…or the villain. But to be the hero, you need the right tools.
How Hubbard Decision Research Can Help
For 20+ years, Hubbard Decision Research has been “spreading the gospel” about probabilistic methods across many areas of industry and government. Probabilistic forecasting has been shown to yield the best results across all the industries where it has been measured and studied. We have the experience and expertise to bring these methods into any organization and any challenge. This year, HDR has also built a reputation for accurate forecasting and predictions with COVID related issues for businesses and municipalities, as well as national forecasting. We have presented webinars for the GFOA, and worked on COVID related operational risk projects for school districts, insurance and reinsurance companies, and a variety of other industries. Our Applied Information Economics methodology has been applied across industries, government, and the military and focuses on improving decisions through probabilistic modeling.
Turn your vaccine distribution solution into an optimized quantitative solution. HDR offers a 20% discount on our rates for governments and nonprofits. Contact us to learn more.
[1]https://www.biorxiv.org/content/10.1101/2020.11.15.383323v1
[2] https://www.cell.com/immunity/pdf/S1074-7613(20)30312-5.pdf
[3] https://www.medrxiv.org/content/10.1101/2020.04.14.20065771v1.full.pdf
[4] https://www.nature.com/articles/s41586-020-2550-z?flip=true
[5] https://academic.oup.com/cid/advance-article/doi/10.1093/cid/ciaa1780/6000389


