
Summary: By measuring how their experts price projects and price elasticity, HDR was able to build our client a pricing model that tripled their operating income.
A few years ago, a medium-sized manufacturing firm came to HDR to help redefine how they quote projects. This firm was in a business environment where their experts would give out unique quotes for custom projects of varying scale and scope. Due to the unique nature of each project, the experts at the firm lacked generalizable data to inform consistent pricing decisions. The firm instead relied on a combination of expert intuition and project cost estimates when quoting prices for a project.
As a senior quantitative analyst at HDR, I was tasked with modeling their existing pricing structure to identify areas for improved consistency and optimization. Using the following high-level steps resulted in margins increasing by 48% and operating income tripling within 18 months of implementing our models.
- Model How they Currently Price Project Quotes
- Model Price Elasticity
- Model Constraints and Optimize Portfolio
Creating a Baseline Using the Lens Method
At HDR we often hear “We simply don’t have enough data.” or” We face too many unique factors.” from clients when describing why they have difficulty quantifying fundamental aspects of their business. Yet there are certain methods we routinely use that can address these perceived limitations, all of which are illusions. One method that addresses these limitations is the Lens Method.
The Lens Method is a regression-based approach that has been used in different industries for decades and has been shown to measurably reduce inconsistency in forecasting models. To develop a lens Model, HDR works with clients to define and identify potential factors that may affect key output metrics. After the factors (or attributes) have been identified, we then generate hundreds of hypothetical scenarios leveraging different combinations of variables for experts to review and estimate the key metric we are trying to measure. In this client’s case, the key metrics we were attempting to measure were the price they would quote to the client and the probability of winning the project. We created 150 hypothetical scenarios that contained factors that our client would consider when quoting a project.
After gathering their responses to these scenarios, we were able to generate a model that would predict how the expert would price a potential project and what probability of winning the project they would assign. What’s more, the model of the experts would outperform the experts themselves. This is due to human judgment being very susceptible to noise. These lens models were used as a basis for our client when pricing potential projects and estimating the probability of winning the project.
Measuring Price Elasticity
The next phase of the work was focused on measuring price elasticity or bid-price sensitivity. In other words, to answer the question: How does a 10% increase in quoted price affect the probability of winning the project P(Win)?
To accomplish this, we created a controlled experiment where our client would purposely deviate from the lens model price by a fixed percentage. This allowed us to create models that measured price elasticity for different markets. Certain markets may face different competitive environments which leads to different price elasticities. A 10% increase in the bid price in a market with limited competition will have a smaller decline in P(Win) than in a market with many competitors.
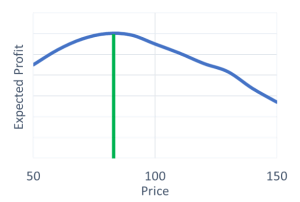
Measuring the relationship between price and P(Win) or quantity sets up a classic economics problem that every economics student learns through college. “Find the price that maximizes the expected profit.” Expected profit in my client’s case is simply profit from the project times the P(Win). However, for our client, and most firms in the real world, there exist extra constraints to consider such as regulatory restrictions, reputation damage, and relationship to other projects in the portfolio.
Figure 1: Illustration of classic price optimization problem.
Modeling Constraints and Optimizing Prices for the Entire Portfolio of Projects
Like many firms in the manufacturing industry, our client cannot rapidly increase production based on short-term increases in market demand. It takes significant investments in capital and human labor to expand their capacity. Simply optimizing each price for each quote, as illustrated in Figure 1, may lead to issues of overcapacity.
While having “too much” business is a good problem to have, in our client’s case it would lead to increased labor costs as they are forced to pay for overtime and may incur longer timescales for delivery which would hurt their reputation and lead to less revenue in the future.
To account for this, we not only had to consider the direct cost of a project but also the opportunity cost of a project. Different projects can have different margins. We wanted to use pricing as a tool to ensure our client’s limited capacity would be filled with the most profitable projects first and then filled up with the less profitable projects to fill up the remaining capacity.
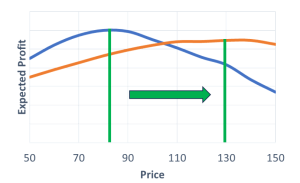
Taking the opportunity cost into consideration, can affect what the optimal price should be for a project. If a project is less profitable than most others in a portfolio, then the optimal price will shift to the right compared to what it should be when measured in isolation. (Figure 2).
Figure 2: Optimal price with and without opportunity cost. Note this chart is purely for illustrative purposes and was not based on actual data from our client.
Ends Results and Applications for Other Organizations
Near the beginning of this year, this client contacted HDR to inform us of how satisfied they were with the models we developed and their performance. The client estimated optimization models had increased their margins by 48% and “tripled their operating income in 2023.” This resulted in a very high ROI on hiring HDR.
As impressive as these results were from this client, they are certainly not unique. Time and time again, we have found that quantifying all aspects of important decisions leads to different decisions being made and, ultimately, better financial outcomes It is not uncommon for us to see the models we develop for our clients cause them to make different decisions or prioritize different measurements that end up saving or earning them a magnitude more than the amount they hired us for.
Some of the projects and methods used with this client we routinely use for projects involving cybersecurity, enterprise risk, military fuel costs, goodwill investments, ESG factors, and many others. If your organization is having difficulty quantifying essential items that affect your decision-making, please feel free to contact us.
