It has been a heck of a winter for Portland, OR. The city has had nine school closure days due to snow and other winter weather. Per local reports, the metro area has been effectively shut down on many of these days. Portland’s transportation bureau budgets $300K a year for materials to respond to winter storms, and has 55 snowplows. In contrast, Portland’s GDP is $160 B/year which translates to $635 MM per work day.
At first blush, there is an intuitive sense that spending a fraction of a percent of one day’s GDP is going to be less than the optimal amount, but there are some mitigating factors. First, the relevant metric is not the amount of disruption that snow creates, but the amount of disruption avoided by having a larger snow budget. Next, this is an unusual winter (the worst in 10 years or more) so the average snow days a year is the more relevant metric. Additionally, the government can find itself in a no win situation where they get blamed for wasting money on years with no snow, and blamed for being unprepared and incompetent during years with heavy snow. But what is the correct strategy to optimize response to winter snow? How can we use small data skills and measurement principles to help form this strategy?

Costs
Let’s start by making some estimates. As a reminder with the AIE methodology we make estimates that represent a 90% confidence interval (the author provides all estimates for this model).
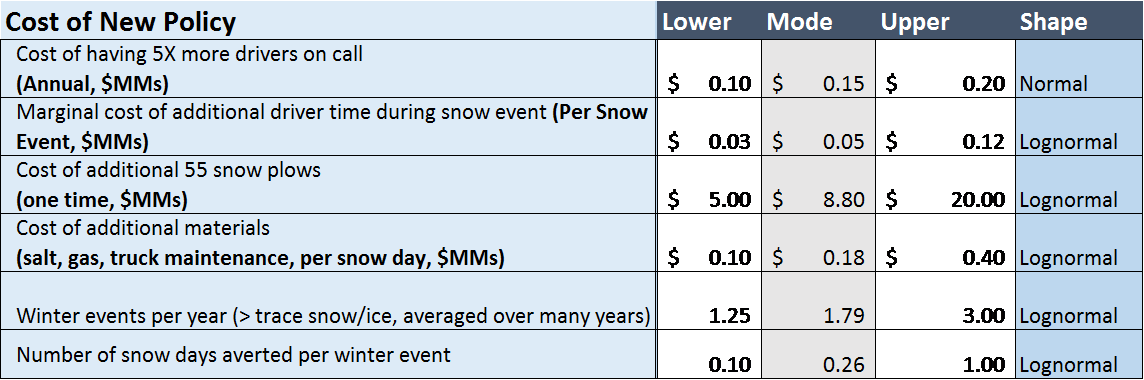
Table 1
So, for the variable “number of snow days averted per winter event” I’m 90% confident that with twice as many plows and five times as many drivers, Portland (on average over many events) would avoid at least one snow day for every ten winter events and no more than one snow day per winter event. Make sense? It is possible (albeit unlikely) that they would avoid more than one snow day per event if the city is shut down for many days with some events and that could have been prevented. My estimate for “winter events per year” is narrower since we have easily accessed data. Portland has an average of 3 inches of snow a year and an average of two “snow events.” Using an estimate of 1.25 to 3 winter events gives us some wiggle room since definitions of “event” and the reality at different elevations in the city varies.
I then create a cash flow of these costs, and take random draws from the estimates I’ve made (see example in Table 2 below). There is a great deal of variance in these costs so when I do the analysis, I will generate 10,000 random scenarios.
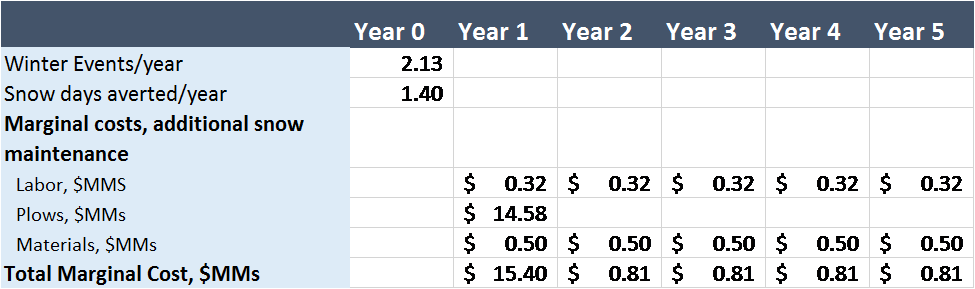
Table 2
Benefits
Before we generate a Monte Carlo, we need to also include the benefits of avoiding a snow day. Since the benefits are going to be averting snow days, we can calculate the economic cost of one snow day, and then multiply that by the number of snow days averted per year.
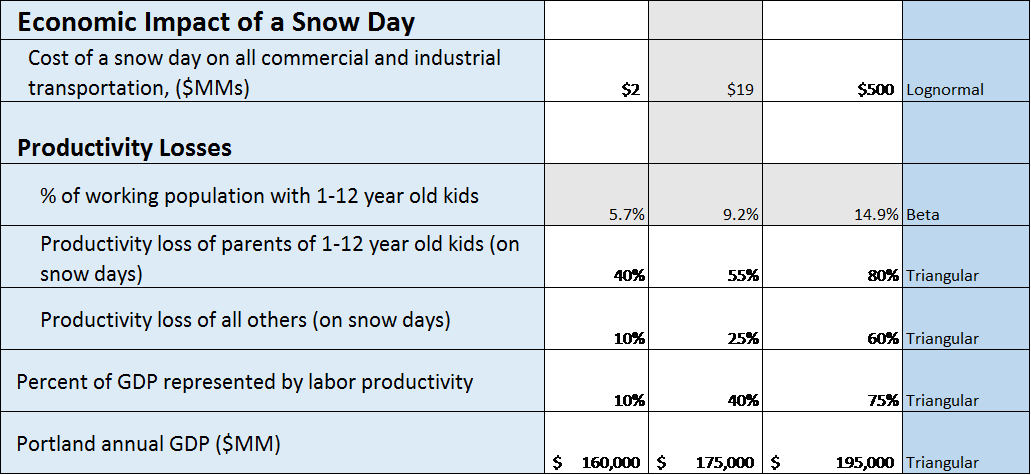
Table 3
The variable I had the most uncertainty on was the impact of a snow day on transportation, since Portland is a major thoroughfare from Seattle to California, the Northwest to Eastern US and even foreign destinations. I also had uncertainty about what percentage of commercial transportation was shut down by a snow day – this could vary from nearly all of it (if the city/state was effectively shut down) to a small percentage of it (if most of the commercial transportation could pass through and get around in Portland). I therefore gave a lower bound to the impact of $2 million and an upper bound of $500 million. A big advantage of the probabilistic approach is that great uncertainty does not prevent you from modeling!
The other major cost of a snow day (or benefit of avoiding one) is lost productivity from the labor force. This loss is particularly keen for parents of 1-12 year old children so I estimate this group separately from the rest of the labor force. Also, only a portion of GDP is directly attributed to labor and its productivity, so that further reduces our estimate of impact.
I added the benefit logic to the cash flow and found the gains possible from averting snow days was staggering.
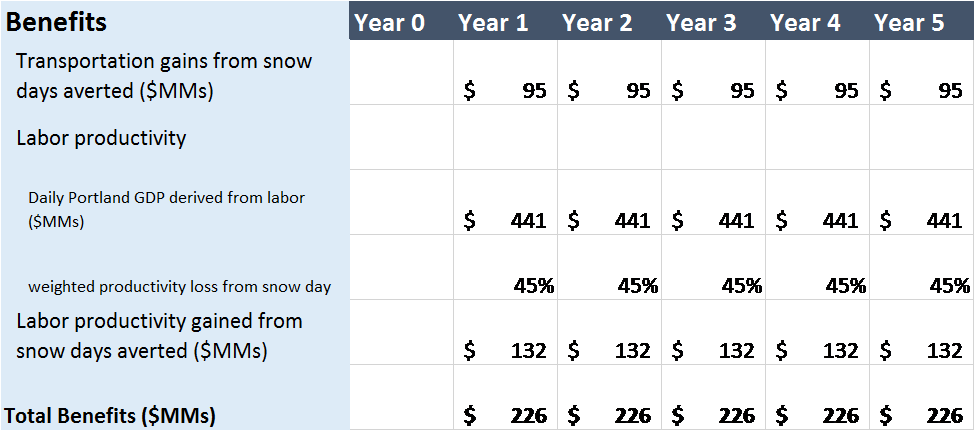
Table 4
Simulation of Net Benefits
It is unusual to run a probabilistic cost benefit analysis and not find at least a single digit percentage chance that the investment results in a loss. A 5% chance of a loss is essentially a “slam-dunk.” In this case, there was literally not one scenario in 10,000 that resulted in a loss.
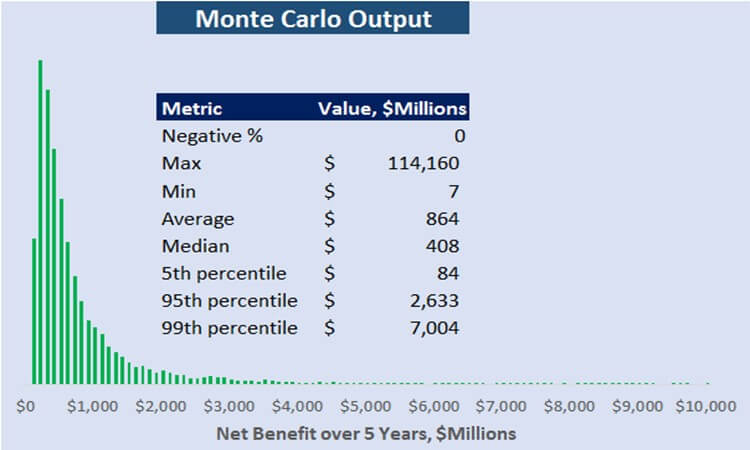
Figure 1
The information value for any variable in this model is precisely zero. There is no uncertainty, and therefore mathematically speaking no economic justification for measurements or reducing uncertainty. But because this was such an unusual result, I immediately began to question my modeling. What did I miss? Which estimates were off? We can use a Bayesian approach to know when it is likely we have made a mistake. After all, what is more likely: a modeling error or a result that you would predict to see only 1% of the time? If there is even a 10% chance of a significant modeling error, it is much more likely that the model is wrong than of seeing this unusual of a result.
I began with the cheapest measurement method out there – secondary research in the form of a Google search! This quickly lead me to believe that my result was relatively valid. First, I found a study (The Economic Costs of Disruption from a Snowstorm) with evidence that confirmed the large cost of snow shutting down a region. A conclusion of the study, conducted by IHS Global Insight was that the economic cost of shutting down a state for one day because of unusable roads during a snowstorm is greater than the cost of cleaning up the snow all season. Wow! Well my findings seemed to be in harmony with this study. Second, Portland has a very modest snow budget compared to most northern cities and states (for example the state of Wisconsin – with a comparable GDP to Portland – budgets $75 million/year for snow removal). For sake of comparison, the study found that snow shutting down Wisconsin for a day cost $149 MM! Since there were 14 states of various geographic and economic size, I had the basis for a small data measurement. Using a regression of the findings in the study would lead me to estimate the cost of shutting down Portland for a day to be between $100 MM and $150 MM – which was well within the range of my estimates.
Conclusion
Rarely does one find such a strong case for an investment as for Portland doubling their annual snow maintenance budget and spending a few million dollars on snow plows. Based on the model, the best estimate for ROI on this investment is over 10,00%! From a philosophical perspective (and assuming the result is accurate), the existence of this magnitude of ROI depends on an incentive problem for the investor. This type of incentive problem is a common challenge in government where they are open to criticism for spending without directly reaping its benefits. In no way do I mean to be an apologist for government; I’m merely pointing out it would be difficult to imagine this sort of investment being available to a traditional actor who could directly reap the benefits of their investment. In this case, however, the investment appears to be a good one despite the incentive issue. Purely based on the higher tax revenues the city of Portland would experience a net gain from the improved GDP. If Portland only saw 1% of the increased GDP (which seems incredulously low), the ROI would still be significantly positive on investing more in their snow budget.

Another variable: How does snow closure affect emergency services- IE does the difficultly of first responders reaching those in need cause an increased cost due to loss of life and property?