customizable coronavirus (covid-19) operational risk REPORT
Providing daily, weekly, or Twice-weekly Probabilistic Forecasts tailored to inform your operational decisions for mitigating a rapidly-changing threat
,Hubbard Research
STAY AHEAD OF THE CORONAVIRUS CURVE: THE GROWING IMPACT ON YOUR ORGANIZATION’S OPERATIONAL RISK
The COVID-19 coronavirus pandemic that is currently spreading across the globe threatens not just the health of every person, but the health of every organization. From lower productivity to higher insurance rates, slower and more irregular supply chains, and other potential disruptions, the threat of critical disruption to key operations is real. And as the number of cases grows, so does the operational risk for an organization.
This is the coronavirus curve, and an organization needs to know where the curve is so they can stay ahead of it.
With our innovative Coronavirus Operational Risk Report, we provide the means for organizations to:
Reports can be customized to your organization’s specific needs, including: timeframe, delivery method, scope, subject matter, and more. The insight we deliver can be easily incorporated into your current decision-making process, even if you don’t already use statistical modeling. And, we don’t use risk matrices, “high-medium-low” ratings, weighted scoring, heat maps, or other pseudo-quantitative methods that introduce more error than they eliminate.
the DELIVERABLE
how our customizable reports deliver the insight you need
HDR has conducted probabilistic analysis on the spread of this virus using our industry-leading Applied Information Economics (AIE) methodology that incorporates probabilistic modeling to create actionable projections. The projections so far have tracked well with subsequently observed outcomes.
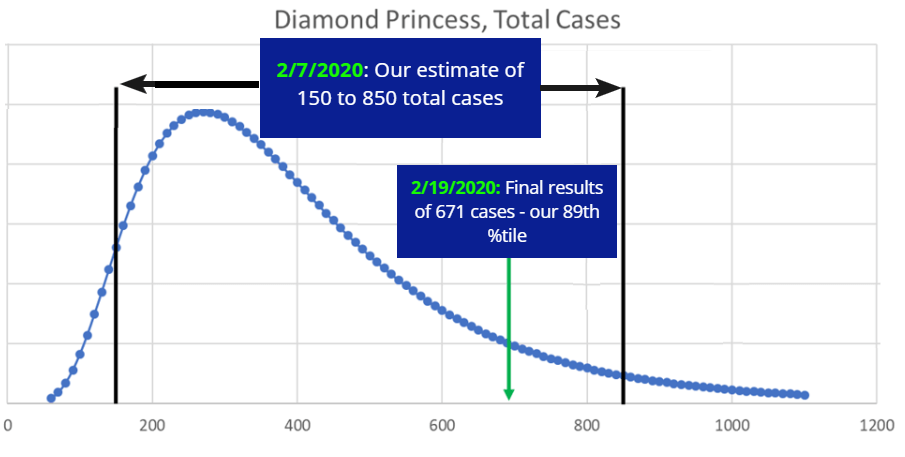
For example, we forecasted a 90% confidence interval for the number of total cases on the quarantined Diamond Princess cruise ship prior to the tests being conducted. The figure below shows the forecast made 12 days before the tests were given and the outcome after test results were known. Note that the actual result was well within the forecasted range, and this result was repeated on multiple forecasts.
Reports are customizable by:
- Frequency: Receive updates daily, weekly, or twice-weekly
- Location: Choose the domestic or international locations you want to monitor and forecast
- Timeframe: Determine how far out from the present you want to forecast (i.e. 7 days, 14 days, 30 days)
- Delivery method: Tailor the content and method of the deliverables to what your decision-makers prefer
- Optional consulting: Work with us to develop a more complete probabilistic model that can measure more variables and make additional forecasts to further quantify and mitigate operational risk
The result: actionable intelligence beyond what organizations have now through more accurate and more timely forecasts.
Only measuring the right things in the right way, and building a decision model to help inform better decisions, can move your organization ahead of the coronavirus curve.


