
I have been a Formula 1 fan, and a motorsport fan in general, for as long as I can remember. Some of my favorite childhood moments were spent watching drivers like Damon Hill and Mika Häkkinen go to battle with Michael Schumacher. As I got older, the data and strategy elements of F1 became more and more fascinating as I learned about statistics, probability, and analytics. Over time, I started to realize that F1 teams were just applying the same methods to solve their unique problems and optimize their decisions. This in itself isn’t shocking, but to a student at university, it was eye-opening. When managers collect reports and review dashboards, it should be for the purpose of informing decisions. If there is no intention or ability to act on this information, its value is zero. But do they know what specific decisions they are trying to inform? Do they know the combinations of all the data they read that should inform a specific action at a specific time? Often, they rely on hope. They hope that among all the data they receive they will detect when action is needed. They hope they will choose the right action based on accurate forecasts of outcomes based on that data. But a manager doesn’t have to rely on their ability to detect what may be subtle movements in several data sources, run forecasts in their heads, and make subjective judgements based on that. Some decision makers know that the consequences of delayed and poor-quality decisions are unacceptable. Formula racing, for example, has a solution for making well thought out decisions based on dozens of rapidly changing variables in tight time constraints.
F1 teams have to make decisions under uncertainty, just like any other organization. For example, determining the optimal tire strategy is fundamental in order to maximize a team’s result in a race. The consequences of these decisions are massive, not only from the sporting side but also from the financial side. Whether the outcome of a decision impacts winning a race, a world championship, or scraping the last points position in a Grand Prix, there is substantial consequence.
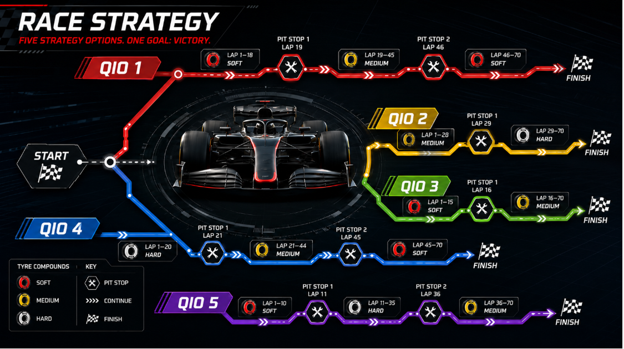
Optimizing these decisions relies on the use of quantitative intervention options, or QIOs. QIOs are predefined interventions based on signals in data. They are tied to thresholds where action needs to be taken. Delays in taking action, or acting too early, can result in suboptimal performance. In F1, that can cost teams points or victories. In other organizations, similar delays can cost millions of dollars.
Staying with our tire strategy example, strategy engineers and data teams constantly wade through millions of data points trying to find the ideal conditions that prompt a driver to pit. The ocean of data is continuously tracked and fed into decision models that run simulations to determine the optimum strategy given the information available. The weather, tire temperature and pressure, engine temperatures, lap time, including sector time and mini-sector time, fuel levels, tire wear information from observing other teams, and feedback from the driver are all examples of factors being considered and acted upon in real time. Pulling the trigger at the right time requires clearly defined QIOs, which are thoroughly discussed during team strategy meetings. These QIOs can result in large lists of strategy options to consider depending on what happens during a race. You often hear Ferrari team radios where the race engineer says, “We are on plan C,” for example. That means the strategy team has observed a pattern in the data that suggests a QIO is needed to optimize the race result. In fact, work by Thomas and colleagues (2025) demonstrated improvements based upon QIOs can be optimized using reinforcement learning showing how specific strategy optimization can improve finishing position (I reference the article at the end of the post).
In F1, you’ll often see a team react a fraction late to another team’s optimal strategy, and that can cost a team or driver a win or valuable points. It can be a game of fine margins. The same thing is true for critical business decisions surrounding projects. In Doug’s latest book, How to Measure Anything in Project Management, the signals for canceling a project were present well before the plug was pulled. Canceling a project late, or not pivoting early, can have a huge cost. According to work done by Oxford Global Projects, less than 1% of projects, from a sample of over 16,000, finish on time, on budget, and with the expected benefits, meaning many of these projects should have had QIOs to avoid costly delays or better identify the conditions in which a project needs to be canceled.
One of the most common objections we get when starting out on projects or from individuals taking our training is that we don’t have all of the variables. Neither do F1 teams. They can’t foresee everything, but they have processes in place that allow them to be nimble and take action using what information they have to optimize the outcome, even when crazy stuff happens over a race weekend. During a race, you’ll often hear a race engineer tell a driver a lap target, then say “plus 5,” or another value, to communicate that the tire strategy is the same, but they are going to go longer on the initial set of tires than initially anticipated based upon the updated data the team has. This could be because there is traffic that the car would come out into behind them, the tire wear was less than they had anticipated at normal racing speed, or they spent time behind a safety car, which extended the life of the tires. Again, this holds true in the business world. No model, quantitative or otherwise, has every single variable mapped out. Despite this, having a quantitative model in place allows for options to be tested and conditions for QIOs to be monitored and optimized. In the paper I cited earlier, the simulated improvements when QIOs were being implemented based upon models, the improvements were pronounced. Finishing positions noticeably improved without any mechanical or aerodynamic changes. This highlights how improved process and utilization of data, quantitative interventions, and planning can drastically improve outcomes.
Going from having no quantitative decision model to an F1-level solution doesn’t happen overnight, nor should it. HDR recommends an iterative approach centered around the decisions that matter to your organization that follows Doug’s Applied Information Economics (AIE) framework. AIE is a practical collection of methods designed to optimize efficiency by identifying what variables actually need to be measured or monitored for a particular decision. See Figure 1 for a diagram about the AIE framework.
Step 1: Define your decision or decisions.
This sounds simple, but in order to create decision-driven dashboards, you need at least one clearly defined decision. This could be which vendor to use for a project, whether to hire additional resources, or whether to cancel a project. In F1, one decision could be whether the car should pit to replace a damaged front wing.
Step 2: Model your current state of uncertainty.
You do not need to boil the ocean in your model from the beginning. You want to leverage well-informed calibrated estimates, or easily accessible information, to start with. Modeling what you know now saves time and resources later. Many of the variables organizations spend time measuring have no influence on actual decisions and end up wasting time. For the F1 front wing example, you might estimate a range of time loss given the damage and include that uncertainty in a model.
Step 3: Determine the value of additional information.
The monetary value of measuring each variable in a model can be computed by determining the value of information, or VOI. VOI helps prioritize resources by identifying the variables that can actually influence your decision. As mentioned in Step 2, many of the variables organizations routinely measure have little to no impact on the decisions they actually care about. By computing information value, you can measure what actually matters. In the front wing example, this would mean determining the value of better information about the amount of time the car is expected to lose because of the damage.
Step 4: Measure high-value information.
As Doug wrote in his first book, How to Measure Anything: Finding the Value of Intangibles in Business, everything is measurable. Objections to this usually stem from a misunderstanding of the concept, object, or method of measurement. High-information-value variables are often easier to measure than lower-information-value variables because they are usually more uncertain. If a range for a given variable is wide, reducing that range does not require as much information as it would if the range were already narrow.
This step repeats as needed based on additional VOI calculations. For the front wing example, one quick measurement would be to evaluate several mini-sectors as the car is on its way back to the pits. The car has to drive there anyway, or retire from the race. If the mini-sectors show only a minimal loss of time, or if the team can evaluate the points of downforce lost and simulate the effect further, it might not be worth coming in to replace the wing. After a few mini-sectors, the uncertainty regarding time loss should be reduced enough to inform the QIO.
Step 5: Optimize the decision.
Take the information from the model and apply it to the actual decision. Rely on decision-driven dashboards to indicate what action should be taken. This does not take away from the expertise of the team. Rather, it reuses that expertise in a way that avoids many of the pitfalls of human judgment. Decisions with high consequences and complexity should not live inside an individual’s head. They should be explicitly and carefully modeled.
To conclude the damaged wing example, based on the reduced uncertainty from observations, the team would decide whether to replace the wing or continue racing as is, thereby optimizing its race given the damage to the car.
In summary, every organization makes complex decisions under uncertain conditions. To optimize those decisions and produce the best possible outcomes, even in the face of uncontrollable external events, organizations need a quantitative framework and predefined QIOs. Having those in place can change the trajectory of an organization. This applies to virtually every major project or business decision.
If you want to modernize your organization’s decision-making processes and develop decision-driven dashboards, contact Hubbard Decision Research using our Contact Us Page (Contact | Hubbard Decision Research). We have built models with QIOs in many industries including utilities, aerospace, manufacturing, consumer products, and many more. Whether you are a large firm or a family business, you have complicated decisions that have large consequences for your organization. Knowing how and when to act is a competitive advantage.
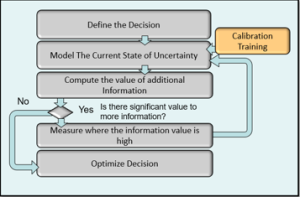
Figure 1 AIE Framework
References:
Thomas, D., Jiang, J., Kori, A., Russo, A., Winkler, S., Sale, S., … & Rago, A. (2025, March). Explainable reinforcement learning for Formula One race strategy. In Proceedings of the 40th ACM/SIGAPP Symposium on Applied Computing (pp. 1090-1097).