If you want to make better decisions, using data to inform your decision-making is the way to go. Organizations largely understand this reality in principle, if not always in practice. But it’s not enough to just gather data; you have to know how to use it, and unfortunately, most organizations don’t.
Fortunately, quantitative analysis doesn’t have to be that difficult. We’ve found over the decades that much of what interferes with data-driven decision-making is confusion, misunderstanding, and misconceptions about measurement in general. As our work with leading public and private entities across the globe has proven, these obstacles can be overcome. Anything can be measured, and if you can measure it, you can improve your decisions.
Below are seven simple principles for making better measurements that form the basis of our methodology, Applied Information Economics (AIE), and – if applied – can quickly improve the quality of the decisions you make (Figure 1).
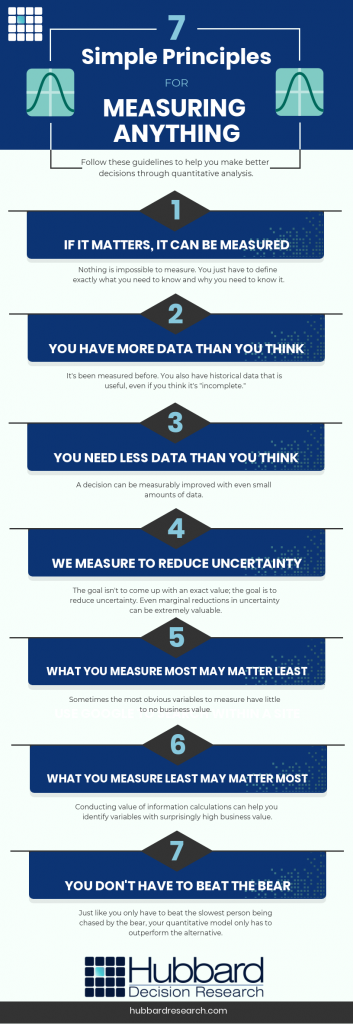
Figure 1: 7 Simple Rules for Measuring Anything – Hubbard Decision Research
7 Simple Rules for Measuring Anything – Hubbard Decision Research
Rule 1: If It Matters, It Can Be Measured
Nothing is impossible to measure. We’ve measured concepts that people thought were immeasurable, like customer/employee satisfaction, brand value and customer experience, reputation risk from a data breach, the chances and impact of a famine, and even how a director or actor impacts the box office performance of a movie. If you think something is immeasurable, it’s because you’re thinking about it the wrong way.
Put simply:
- If it matters, it can be observed or detected.
- If it can be detected, then we can detect it as an amount or in a range of possible amounts.
- If it can be detected as a range of possible amounts, we can measure it.
If you can measure it, you can then tell yourself something you didn’t know before. Case in point: the Office of Naval Research and the United States Marine Corps wanted to forecast how much fuel would be needed in the field. There was a lot of uncertainty about how much would needed, though, especially considering fuel stores had to be planned 60 days in advance. The method they used to create these forecasts was based on previous experience, educated assumptions, and the reality that if they were short on fuel, lives could be lost. So, they had the habit of sending far more fuel to the front than they needed, which meant more fuel depots, more convoys, and more Marines in harm’s way.
After we conducted the first round of measurements, we found something that surprised the Marines: the biggest single factor in forecasting fuel use was if the roads the convoys took were paved or gravel (figure 1).
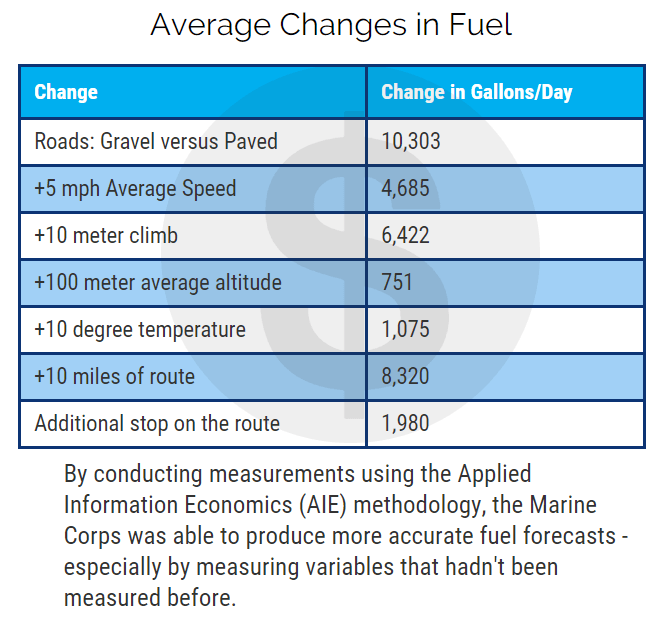
Figure 1: Average Changes in Fuel
We also found that the Marines were measuring variables that provided a lot less value. More on that later.
Rule 2: You Have More Data Than You Think
Many people fall victim to the belief that to make better decisions, you need more data – and if you don’t have enough data, then you can’t and shouldn’t measure something.
But you actually have more data than you think. Whatever you’re measuring has probably been measured before. And, you have historical data that can be useful, even if you think it’s not enough.
It’s all about asking the right questions, questions like;
- What can email traffic tell us about teamwork?
- What can website behavior tell us about engagement?
- What can publicly available data about other companies tell us about our own?
Similarly…
Rule 3: You Need Less Data Than You Think
Despite what the Big Data era may have led you to believe, you don’t need troves and troves of data to reduce uncertainty and improve your decision. Even small amounts of data can be useful. Remember, if you know almost nothing, almost anything will tell you something.
Rule 4: We Measure to Reduce Uncertainty
One major obstacle to better quantitative analysis is a profound misconception of measurement. For that, we can blame science, or at least how science is portrayed to the public at large. To most people, measurement should result in an exact value, like the precise amount of liquid in a beaker, or a specific number of this, that, or the other.
In reality, though, measurements don’t have to be that precise to be useful. The key purpose of measurement is to reduce uncertainty. Even marginal reductions in uncertainty can be incredibly valuable.
Rule 5: What You Measure Most May Matter Least
What if you already make measurements? Let’s say you collect data and have some system – even an empirical, statistics-based quantitative method – to make measurements. Your effectiveness may be severely hampered by measuring things that, at the end of the day, don’t really matter.
By “don’t really matter,” we mean that the value of these measurements – the insight they give you – is low because the variable isn’t very important or isn’t worth the time and effort it took to measure it.
What we’ve found is a bit unsettling to data scientists: some of the things organizations currently measure are largely irrelevant or outright useless – and can even be misleading. This principle represents a phenomenon called “measurement inversion” (Figure 2):
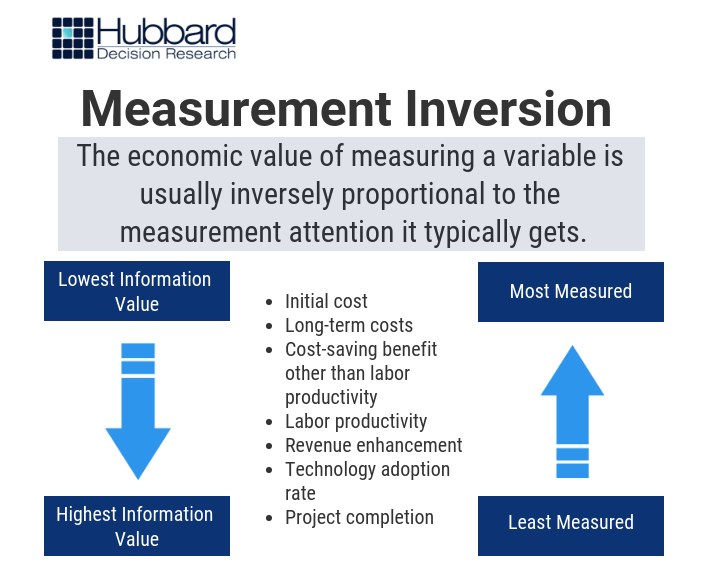
Figure 2: Measurement Inversion – Hubbard Decision Research
Unfortunately, it’s a very common phenomenon. The Marine Corps fell victim to it with their fuel forecasts. They thought one of the main predictors of fuel use for combat vehicles like tanks and Light Armored Vehicles (LAV) was the chance that they would make contact with the enemy. This makes sense; tanks burn more fuel in combat because they move around a lot more, and their gas mileage is terrible. In reality, though, that variable didn’t move the needle that much.
In fact, the more valuable predictive factor was whether or not the combat vehicle had been in a specific area before. It turns out that vehicle commanders, when maneuvering in an uncertain area (i.e. landmarks, routes, and conditions in that area they had never encountered before), tend to keep their engines running for a variety of reasons. That burns fuel.
(We also discovered that combat vehicle fuel consumption wasn’t as much of a factor as convoy vehicles, like fuel trucks, because there were less than 60 tanks in the unit we analyzed. There were over 2,300 non-combat vehicles.)
Rule 6: What You Measure Least May Matter Most
Much of the value we’ve generated for our clients has come through measuring variables that the client thought were either irrelevant or too difficult to measure. But often, these variables provide far more value than anyone thought!
Fortunately, you can learn how to measure what matters the most. The chart below demonstrates some of the experiences we’ve had with combating this phenomenon with our clients (Figure 3):
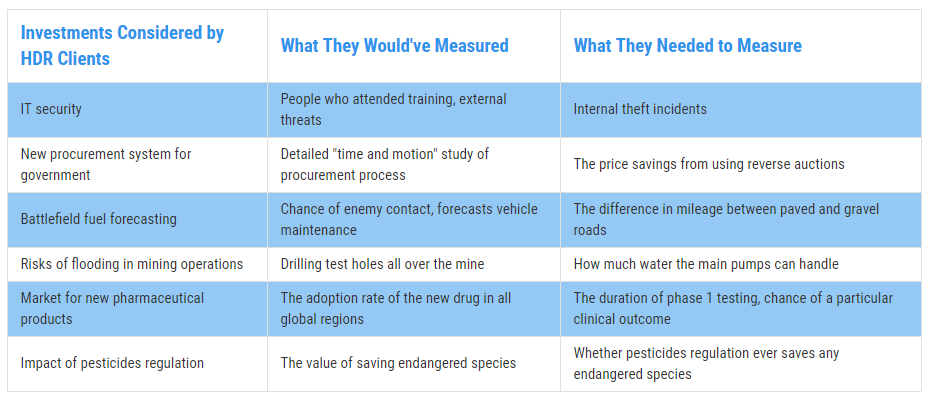
Figure 3: Real Examples of Measurement Inversion – Hubbard Decision Research
This isn’t to say that the variables you’re measuring now are “bad.” What we’re saying is that uncertainty about how “good” or “bad” a variable is (i.e. how much value they have for the predictive power of the model) is one of the biggest sources of error in a model. In other words, if you don’t know how valuable a variable is, you may be making a measurement you shouldn’t – or may be missing out on making a measurement you should.
Rule 7: You Don’t Have to Beat the Bear
When making measurements, the best thing to remember is this: If you and your friends are camping, and suddenly a bear attacks and starts chasing you, you don’t have to outrun the bear – you only have to outrun the slowest person.
In other words, the quantitative method you use to make measurements and decisions only has to beat the alternative. Any empirical method you incorporate into your process can improve it if it provides more practical and accurate insight than what you were doing before.
The bottom line is simple: Measurement is a process, not an outcome. It doesn’t have to be perfect, just better than what you use now. Perfection, after all, is the perfect enemy of progress.
Incorporate these seven principles into your decision-making process and you’re already on your way to better outcomes.
Learn how to start measuring variables the right way – and create better outcomes – with our two-hour Introduction to Applied Information Economics: The Need for Better Measurements webinar. $100 – limited seating.

