Update: A new batch of test results was released on 2/15/2020, bringing the total number so far to 355 confirmed infections. The cruise ship has another week left in quarantine, and officials expect more cases to come – in line with our estimates (see below).
The Diamond Princess, a cruise ship carrying 3,700 passengers and crew, has been in quarantine ever since a passenger from Hong Kong fell ill with the 2019 novel coronavirus (2019 n-CoV).
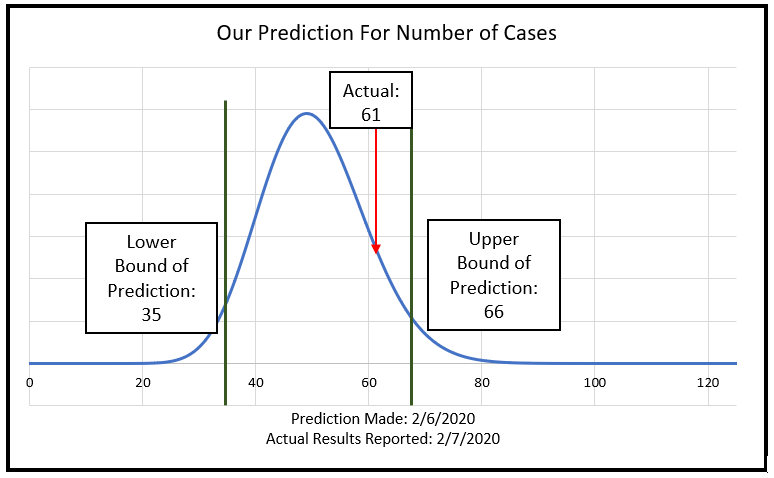
On 2/6/2020, we estimated that the total number of positive test results from the first 273 samples would be between 35 and 66. Today, 2/7/2020, the testing was completed and reported – and the number of samples that tested positive (61) fell within our estimated range (see Figure 1 below).
But, a more impactful question remains: How many passengers will ultimately become infected?
Today, 2/7/2020, we estimate the total number of coronavirus infections on the Diamond Princess as 150 to 850. We’ll explain the methodology we used to make this estimate, but the salient point is this: If the “hidden” population of the virus is large as we predict it holds important implications for policy makers (and the general public).
First, we’ll revisit our estimate from earlier this week. This estimate was made using a Beta distribution on the first 102 tests and applying it to the remaining 171 tests. (Figure 1).

Using a probabilistic model, we now give a 90% confidence interval for the total number of coronavirus infections on the Diamond Princess on 2/3/2020 as 150 to 550. Because infections could continue to occur between people in the same cabins after the quarantine, our 90% confidence interval for total infections before the quarantine is released is 150 to 850.
It is virtually impossible that the initial 61 are the only 2019 n-CoV cases on board the Diamond Princess. Why?
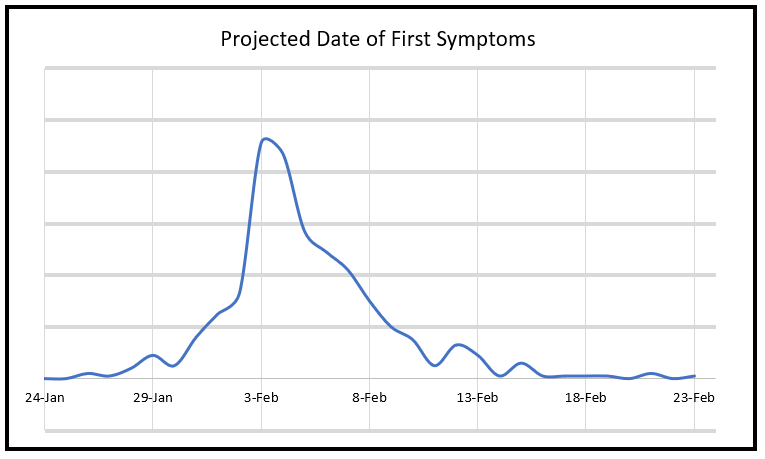
The answer is found in our article from 2/3/2020 – this disease has a long incubation period when people are asymptomatic but potentially infectious. This means there is likely a large group of people who are asymptomatic and not in the group of 273 but who do have the virus (Figure 2).

Figure 2: Projected date of first symptoms of 2019 n-CoV on Diamond Princess, given no infections after the 2/3/2020 quarantine. (No y-axis value is given since a wide range of total infections is possible).
Put another way, if one or two individuals could start a chain reaction on 1/21/2020 that created 61 symptomatic passengers by 2/2 – 12 days later – how many people would those symptomatic passengers have infected in the days before the quarantine? The answer to this question lies in knowing the average and distribution of the incubation period.
Using the Incubation Period to Estimate Asymptomatic Cases
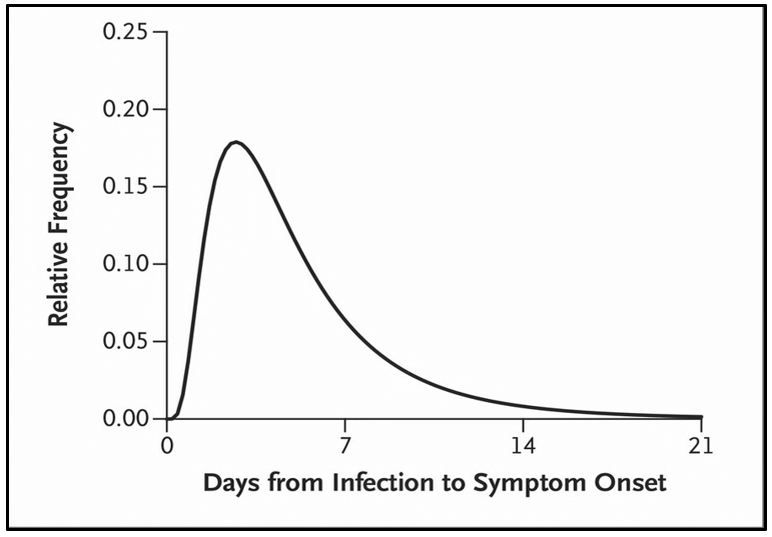
The mean incubation period has been estimated in the New England Journal of Medicine as 5.2 days, with the 95th percentile of the distribution at 12.5 days. We are slightly troubled taking the values from these early cases as canonical (the same case study indicated a doubling time of 7.4 days which is clearly inconsistent with cases multiplying from 41 on 1/1/2020 to 32,000+ on 2/6/2020).
However, this is the best evidence based estimate we have, and it seems consistent with other (more recent) anecdotal cases where exposure and first symptom times are well known (such as cases 19-22 in Singapore). The NEJM incubation estimate is well described by a lognormal function with a mean of 1.425 and a standard deviation of 0.67 (Figure 3).

Figure 3: The incubation time described by the recent NEJM article is well modeled by a lognormal curve (mu=1.425 and sigma = 0.67
The Utility of Probabilistic Models
Given that 61 people were symptomatic with the coronavirus by 2/2 or 2/3, how do we calculate the total number infected before the quarantine? We do this with a Monte Carlo model – using the incubation time described above and solve for what the doubling interval would have to be to produce 56 to 61 symptomatic people by 2/2 or 2/3. It matters a great deal if the original group of 273 was selected on 2/2 to be tested or 2/3. This can be seen visually in Figure 2 (the proportion of the curve up to 2/2 is much smaller than to 2/3).
The best fit if the group was selected on 2/2 would be a doubling time of 1.33 days, implying 530 people would have been infected by the quarantine. If the group was selected on 2/3, the best fit doubling time would drop to 1.48 – implying a best guess of 275 people infected prior to the quarantine.
Additional Sources of Uncertainty
Note that 275 to 530 does not represent our 90% confidence interval. We would place about a 60% chance of certainty on that range. However, there are significant additional sources of uncertainty:
- Most importantly, the incubation could be significantly different than what the early evidence indicated. This could make the range go up or down.
- We don’t know the passenger from Hong Kong was the only one who had 2019 n-CoV. Other passengers could have had it or gotten infected early on in other ports. If so, this would make the range go down.
- If passengers on board are sharing rooms, there is the possibility for further infections after the quarantine started. If that occurs, this would make the final infection number go up.
The best-case scenario is that the tested group was symptomatic on 2/3/2020, that there was another source of coronavirus on board by 1/21/2020, that the true incubation is shorter, and that there were relatively few infections after the quarantine. In this case, the best estimate of infections would be around 150.
The worst-case scenario is if the tested group was symptomatic by 2/2/2020, there were no other cases of 2019 n-CoV on the ship on 1/21/2020, the true incubation period is longer, and there were significant infections of family members after the quarantine. In this case, the best estimate of infections would be around 850.
Therefore, our 90% confidence interval for all infected passengers before the ship is released, assuming the quarantine is maintained, is between 150 and 850.
Drawing the Right Conclusions
Here, it’s important to provide a non-quantitative side-note. The people who are sick or quarantined on the ship are not numbers on a page – they are real people who are facing a difficult trial. My thoughts go out to these people, and my gratitude to the cruise operators and all the medical and support staff that are helping in this situation. May they be given strength and not fear their situation; may the sick passengers be comforted by the knowledge that Japan has great medical services and there are hopeful signs regarding treatment.
Additionally, it is important that other passengers draw the correct conclusions if additional cases are found in the coming days. Panic is not the best response. In fact, part of the motivation to write this article is to point out that we should all assume there will be reports of additional cases of people who were infected before the quarantine. This is crucial, and my hope is that this message can find its way to the passengers to prevent further unnecessary worry.
Macro Implications
There are potentially valuable implications that come out of this extremely unfortunate situation. This may provide a stark illustration of the hidden population of 2019 n-CoV – although only 61 people were symptomatic on 2/3/2020, there were likely hundreds already infected. This estimate, if correct, is vital to the understanding of policymakers and how the outbreak needs to be handled.
Also, I believe that we should avoid condemning the quarantine as ineffective and should not unnecessarily scapegoat the Diamond Princess staff or Carnival policies. In no way do I intend this to be “apologist” – rather let’s draw the correct conclusions from the data and not give in to emotional but incorrect reasoning.
More importantly, if the “hidden” population of asymptomatic infected people is significantly larger than the population of known cases, then the idea of “best practice” currently adopted in countries other than China may need to change. At this point, we aren’t willing to speculate what those changes might be, but it is worth starting to think about. We will learn a lot by the rate of infection revealed on the cruise ship over the next 7-10 days. Roughly 90% of those infected on or before 2/2/2020 should be symptomatic by 2/10/2020, so we should have a good idea of the total number within a week.
Learn how to start measuring variables the right way – and create better outcomes – with our two-hour Introduction to Applied Information Economics: The Need for Better Measurements webinar. $100 – limited seating.

