Trojan Horse: How a Phenomenon Called Measurement Inversion Can Massively Cost Your Company

measurement inversion

Overview:

  • A Trojan horse is anything that introduces risk to an organization through something that appears to be positive
  • Measuring the wrong variables is a Trojan horse that infiltrates virtually every organization
  • This phenomenon has a real cost that can be measured – and avoided

The Trojans stood at the walls, drunk from victory celebrations after they had previously watched the Greek fleets set sail away in retreat, having been defeated after nearly 10 years of constant warfare. They had little reason to suspect treachery when they saw the massive wooden horse just outside their gates, apparently a gift offering from the defeated Greeks. Because of their confidence – or overconfidence – they opened the gates and claimed the wooden horse as the spoils of war.

Later that night, after the Trojans lay in drunken  stupor throughout the city, a force of Greek soldiers hidden in the horse emerged and opened the gates to the Greek army that had not retreated but had actually lay in wait just beyond sight of the city. Swords drawn and spears hefted, the Greek soldiers spread throughout the city and descended upon its people.

The end result is something any reader of The Illiad knows well: the inhabitants of Troy were slaughtered or sold into slavery, the city was razed to the ground, and the term “Trojan horse” became notorious for something deceitful and dangerous hiding as something innocuous and good.

Organizations are wising up to the fact that quantitative analysis is a vital part of making better decisions. Quantitative analysis can even seem like a gift, and used properly, it can be. However, the act of measuring and analyzing something can, in and of itself, introduce error – something Doug Hubbard calls the analysis placebo. Put another way, merely quantifying a concept and subjecting the data to an analytical process doesn’t mean you’re going to get better insights.

It’s not just what data you use, although that’s important. It’s not even how you make the measurements, which is also important. The easiest way to introduce error into your process is to measure the wrong things – and if you do, you’re bringing a Trojan horse into your decision-making.

Put another way, the problem is an insidious one: what you’re measuring may not matter at all, and may just be luring you into a false sense of security based on erroneous conclusions.

The One Phenomenon Every Quantitative Analyst Should Fear

Over the past 20 years and throughout over 100 measurement projects, we’ve found a peculiar and pervasive phenomenon: that what organizations tend to measure the most often matters the least – and what they aren’t measuring tends to matter the most. This phenomenon is what we call measurement inversion, and it’s best demonstrated by the following image of a typical large software development project (Figure 1):

measurement problems

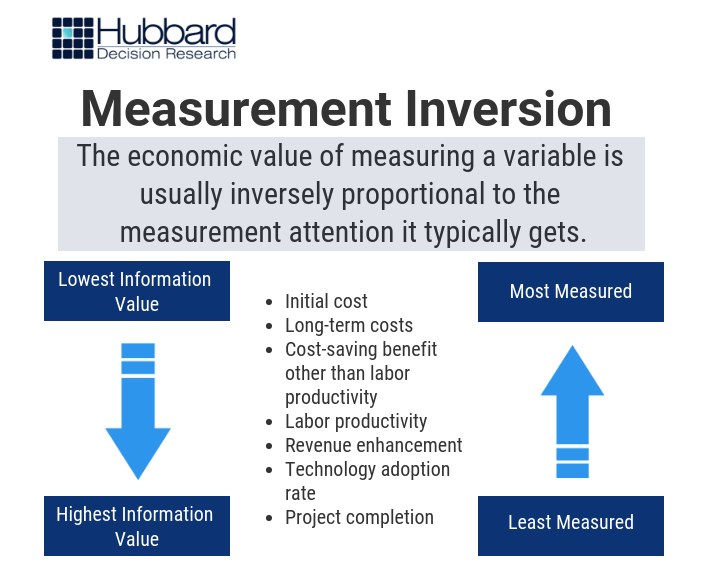
Figure 1: Measurement Inversion

Some examples of measurement inversion we’ve discovered are shown below (Figure 2):

measurement inversion examples

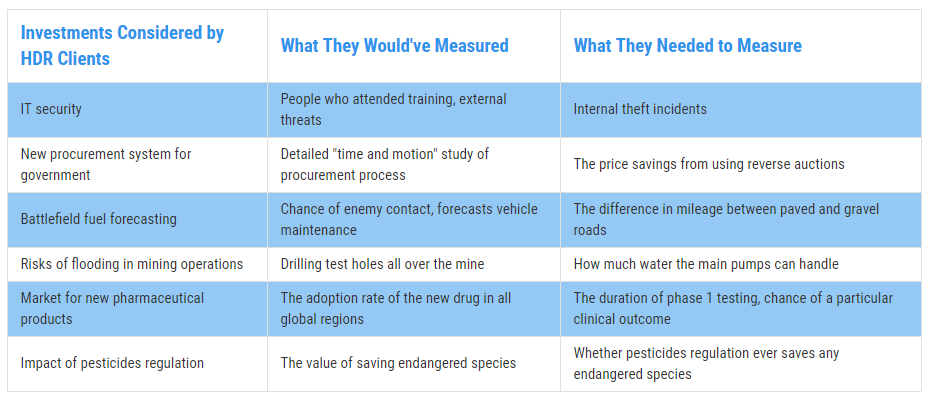
Figure 2: Real Examples of Measurement Inversion

There are many reasons for measurement inversion, ranging from the innate inconsistency and overconfidence in subjective human assessment to organizational inertia where we measure what we’ve always measured, or what “best practices” say we should measure. Regardless of the reason, every decision-maker should know one, vital reality: measurement inversion can be incredibly costly.

Calculating the Cost of Measurement Inversion for Your Company

The Trojan horse cost Troy everything. That probably won’t be the case for your organization, as far as one measurement goes. But there is a cost to introducing error into your analysis process, and that cost can be calculated like anything else.

We uncover the value of each piece of information with a process appropriately named Value of Information Analysis (VIA). VIA is based on the simple yet profound premise that each thing we decide to measure comes with a cost and an expected value, just like the decisions these measurements are intended to inform. Put another way, as Doug says in How to Measure Anything, “Knowing the value of the measurement affects how we might measure something or even whether we need to measure it at all.” VIA is designed to determine this value, with the theory that choosing higher-value measurements should lead to higher-value decisions.

Over time, Doug has uncovered some surprising revelations using this method:

  • Most of the variables used in a typical model have an information value of zero
  • The variables with the highest information value were usually never measured
  • The most measured variables had low to no value.

The lower the information value of your variables, the less value you’ll generate from your model. But how does this translate into costs?

A model can calculate what we call your Overall Expected Opportunity Loss (EOL), or the average of each expected outcome that could happen as a result of your current decision, without measuring any further. We want to get the EOL as close to zero as possible. Each decision we make can either grow the EOL or shrink it. And each variable we measure can influence those decisions. Ergo, what we measure impacts our expected loss, for better or for worse.

If the variables you’re measuring have a low information value – or an information value of zero – you’ll waste resources measuring them and do little to nothing to reduce your EOL. The cost of error, then, is the difference between your EOL with these low-value variables and the EOL with more-valuable variables.

Case in point: Doug performed a VIA for an organization called CGIAR. You can read the full case study in How to Measure Anything, but the gist of the experience is this: by measuring the right variables, the model was able to reduce the EOL for a specific decision – in this case, a water management system – from $24 million to under $4 million. That’s a reduction of 85%.

Put another way, if they had measured the wrong variables, then they would’ve incurred a possible cost of $20 million, or 85% of the value of the decision.

The bottom line is simple. Measurement inversion comes with a real cost for your business, one that can be calculated. This raises important questions that every decision-maker needs to answer for every decision:

  1. Are we measuring the right things?
  2. How do we know if we are?
  3. What is the cost if we aren’t?

If you can answer these questions, and get on the right path toward better quantitative analysis, you can be more like the victorious Greeks – and less like the citizens of a city that no longer exists, all because what they thought was a gift was the terrible vehicle of their destruction. 


Learn how to start measuring variables the right way – and create better outcomes – with our hybrid learning course, How To Measure Anything: Principles of Applied Information Economics.


The American Statistician Presents the Most Important Improvement to Scientific Method in Over 80 Years

Science, we have a problem.  Several problems, actually.  Now we have solutions.  A central tenant of modern science is that experiments must be reproducible.  It turns out that a surprisingly large proportion of published results in certain fields of research – especially in the social and health sciences – do not satisfy that requirement.  This is known as the reproducibility crisis.

I was honored to have the opportunity to be involved in addressing this as both an associate editor of a ground-breaking special Issue of The American Statistician and to co-author one of the 43 articles.  This special issue is called “Moving to a World Beyond p<.05”  Some of my readers will recognize that “p<.05” refers to the “significance test”, ubiquitous in scientific research. This issue is the first serious attempt to fundamentally rethink statistical inference in science since the significance tests currently used were developed almost a century ago.

The article I authored with Alicia Carriquiry (Distinguished Professor of Statistics at Iowa State University) is titled Quality Control for Scientific Research: Addressing Reproducibility, Responsiveness, and Relevance.  We argue that addressing responsiveness and relevance will help address reproducibility.  Responsiveness refers to the fact it takes a long time before problems like this are detected and announced.  The discovery of the current problems of reproducibility only occurred because, periodically, some diligent researchers decided to investigate it.   Years of unreproducible studies continue to be published before these issues are known and even longer before they are acted on.

Relevance refers to how published research actually supports decisions. If the research is meant to inform corporate or public decisions (it is certainly often used that way) then it should be able to tell us the probability that the findings are true.  Assigning probabilities to potential outcomes of decisions is a vital step in decision theory.  Many who have been using scientific research to make major decisions would be surprised to learn that the “Null Hypothesis Significance Test” (NHST) does not actually tell us that.

However, Alicia and I show a proof about how this probability could be computed.  We were able to show that we can compute the relevant probability (i.e., that the claim is true) and that even after a “statistically significant” result the probability is, in some fields of research, still less than 50%.  In other words, a “significant” result doesn’t mean “proven” or even necessarily “likely.”  A better interpretation would be “plausible” or perhaps “worth further research.” Only after the results are reproduced does the probability the hypothesis is true start to grow to about 90%.  This would be disappointing for policy makers or news media that tend to get excited about the first report of statistical significance.  In fact, measuring such probabilities can be the basis of a sort of quality control for science that can be much more responsive as well as relevant.  Any statistically significant result should be treated as a tentative finding awaiting further confirmation.

Now, a little background to explain what is behind such an apparently surprising mathematical proof.  Technically, a “statistically significant” result only means that if there were no real phenomena being observed (the “null” hypothesis) then the statistical test result – or something more extreme – would be unlikely.  Unlikely in this context means less than the stated significance level, which in many of the research fields in question is 0.05.   Suppose you are testing a new drug that, in reality, is no better than a placebo.  If you would have run an experiment 100 times you would, by chance alone, get a statistically significant result in about 5 experiments at a significance level of .05.  This might sound like a tested hypothesis with a statistically significant result has a 95% chance of being of being true.  It doesn’t work that way.  First off, if you only publish 1 out of 10 of your tests, and you only publish significant results, then half of your published results are explainable as chance.  This is called “publication bias.”  And if a researcher has a tendency to form outrageous hypotheses that are nearly impossible to be true, then virtually all of the significant results would be the few random flukes we would expect by chance.  If we could actually compute the probability the claim is true, then we would have a more meaningful and relevant test of a hypothesis.

One problem with answering relevance is that it requires a prior probability.  In other words, we have to have to be able to determine a probability the hypothesis is true before the research (experiment, survey, etc.) and then update it based on the data.  This reintroduces the age-old debate in statistics about where such priors come from.  It is sometimes assumed that such priors can only be subjective statements of an individual, which undermines the alleged objectively of science (I say alleged because there are several arbitrary and subjective components of statistical significance tests).  We were able to show that an objective prior can be estimated based on rate at which studies in a given field can be successfully reproduced.

In 2015, a group called The Open Science Collaboration tried to reproduce 100 published results in psychology.  The group was able to reproduce only 36 out of 100 of the published results.  Let’s show how this information is used to compute a prior probability as well as the probability the claim is true after the first significant results and after it is reproduced.

The proposed hypothesis the researcher wants to test the truth of is called “alternative” to distinguish it from the null hypothesis, where the results were a random fluke.  The probability that the alternative hypothesis is true, written Pr(Ha), based only on the reproducibility history of a field, is:

Where R is the reproducibility rate, and α and π  refer to what is known as the “significance level” and the statistical “power” of the test.   I won’t explain those in much detail but these would be known quantities for any experiment published in the field.

Using the findings of The Open Science Collaboration, R would be .36 (actually we would use those results as a sample to estimate the reproduction rate which itself would have an error, but we will gloss over that here).   The typical value for α is .05 and π is, on average, perhaps as high as .8.   This means that that hypothesis being considered for publication in that field have about a 4.1% chance of being true.  Of course, you would expect that researchers proposing a hypothesis probably have reason to believe they have some chance that what they are testing is true but before the actual measurement, the probability isn’t very high.  After the test is performed, the following formula shows the probability is a claim is true given that it passed the significance test (shown as the condition P< α).

What might surprise many decision makers who might want to act on these findings that that, in this field of research, a “significant” result using an experiment with the same α and π means that now we can say that the hypothesis has only a 41.3% chance of being true.  When (and if) the result is ever successfully reproduced it, the probability the hypothesis is true is adjusted again to 91.9% with the following formula.

If we plot all three of these probabilities as a function of reproduction rate for a given α and π, we get a chart like the following.

Probability the hypothesis is true upon initial proposal, after the first significant result and after reproduction

Other reproduction attempts similar to The Open Science Collaboration show replication rates well short of 60% and more often below 50%.  As the chart shows, if we wanted to have a probability of at least 90% that a hypothesis is true before making a policy decision, reproduction rates would have to be on the order of 75% or higher holding other conditions constant.  In addition to psychology, these findings affect issues as broad as education policy, public health, product safety, economics, sociology, and many other fields where significance tests are normal practice.

Alicia and I proposed that Pr(Ha) itself becomes an important quality control for fields of research like psychology.  Instead of observing problems perhaps once every decade or two, Pr(Ha) can be updated with each new reproduction attempt and that will update all of the Pr(Ha|P<a) in the field at a rate closer to real time.  Now, our paper is only one of 43 articles in this massive special issue.  There are many articles that will be very important in rethinking how statistical inference has been applied for many decades.

The message across all the articles is the same – the time for rethinking quality control in science is long overdue and we know how to fix it.

– Doug Hubbard

Ten Years of How to Measure Anything

On August 3, 2007, the first edition of How to Measure Anything was published.  Since then, Doug Hubbard has written two more editions, three more books, in eight languages for a total of over 100,000 books sold.  How to Measure Anything is required reading in several university courses and is now required reading for the Society of Actuaries Exam prep.

Over the years, Hubbard Decision Research has completed over 100 major measurement projects for clients in several industries and professions.  Clients included The United Nations, the Department of Defense, NASA, a dozen Fortune 500 companies, and several Silicon Valley startups.

Just since the first book, Hubbard Decision Research has trained over 1000 people in the Applied Information Economics methods.  HDR has also been given several new measurement challenges including the following:

  • drought resilience in the Horn of Africa
  • the risk of a mine flooding in Canada
  • the value of roads and schools in Haiti
  • the risk and return of developing drugs, medical devices and artificial organs,
  • the value and risks of new businesses
  • the value of restoring the Kubuqi Desert in Inner Mongolia
  • the value and risks of upgrading a major electrical grid
  • new cybersecurity risks
  • ….just to name a few

We have a lot going on in this anniversary year.  Here are some ways you can participate.

  • Have you been using methods from How to Measure Anything to solve some critical measurement problem?  Let us know your story.  We will be giving the top 3 entries up to $1,000 worth of How to Measure Anything webinars including your choice of any of the “Intro” webinars, Calibration training, and AIE Analyst training or time on the phone with Doug Hubbard.  Send your entry to HTMA@hubbardresearch.com by Friday, August 11.
  • We are continuing our research for a future topic “How to Measure Anything in Project Management”  If you are in the field of project management, you can help with the research by filling out our project management survey.  In exchange, you get a discount on project management webinars and a copy of the final report.
  • We are offering an anniversary special for books and webinars for a limited time.
  • See Doug Hubbard team up with Sam Savage in Houston and DC for our joint Probabilitymanagement.org seminars on modeling uncertainty and reducing uncertainty with measurements.


SaveSave

SaveSave

Three Critical Project Management Measurements You Probably Don’t Track

Sign up for a discount for the webinar “How to Measure Anything in Project Management” presented in person by Doug Hubbard.  Just take a project management survey, and you will also get the summary report of the survey findings.  See details at the end of this article.

Of all the project-management-related measurements a firm could make, there are three that are particularly critical and yet almost never measured.  Each of these are measurements my team have made many times across many types of projects even though some might consider these to be “immeasurable.”

None of these measurements are new.  Mature quantitative methods exist and have been applied to for each of these measurement problems.  Also, each of these methods can be done using nothing more than the statistical functions available in Excel spreadsheets and the methods are simple enough that we cover them in a training course that takes one day.

(more…)

Five Data Points Can Clinch a Business Case [article]

Pop quiz: which of the following statements about decisions do you agree with:

  1. You need at least thirty data points to get a statistically significant result.
  2. One data point tells you nothing.
  3. In a business decision, the monetary value of data is more important than its statistical significance.
  4. If you know almost nothing, almost anything will tell you something.

(more…)

Project Management/Project Risk is the #1 Measurement Challenge

According to our recently completed “Measurement Challenges” survey, project risk and project management-related issues are the #1 most frequently identified measurement challenges, followed closely by change management and organizational transformation.  The survey also showed that while only half have received training to address these problems, the majority feel they need training in statistical methods or even the analytical methods provided in Excel. This is a brief summary of the findings of that survey. (more…)