HDR Launches New Customizable COVID-19 Coronavirus Operational Risk Report

 customizable coronavirus (covid-19) operational risk REPORT

Providing daily, weekly, or Twice-weekly Probabilistic Forecasts tailored to inform your operational decisions for mitigating a rapidly-changing threat

,Hubbard Research

STAY AHEAD OF THE CORONAVIRUS CURVE: THE GROWING IMPACT ON YOUR ORGANIZATION’S OPERATIONAL RISK

The COVID-19 coronavirus pandemic that is currently spreading across the globe threatens not just the health of every person, but the health of every organization. From lower productivity to higher insurance rates, slower and more irregular supply chains, and other potential disruptions, the threat of critical disruption to key operations is real. And as the number of cases grows, so does the operational risk for an organization.

This is the coronavirus curve, and an organization needs to know where the curve is so they can stay ahead of it.

With our innovative Coronavirus Operational Risk Report, we provide the means for organizations to:

Z
Understand and quantify specifically how the pandemic poses a threat
Z
Forecast the spread of coronavirus cases beyond what is currently available to the public
Z
Provide timely interpretation of breaking news as it pertains to operational risk
Z
Make strategic decisions about mitigating operational risk

Reports can be customized to your organization’s specific needs, including: timeframe, delivery method, scope, subject matter, and more. The insight we deliver can be easily incorporated into your current decision-making process, even if you don’t already use statistical modeling. And, we don’t use risk matrices, “high-medium-low” ratings, weighted scoring, heat maps, or other pseudo-quantitative methods that introduce more error than they eliminate.

the DELIVERABLE

how our customizable reports deliver the insight you need

HDR has conducted probabilistic analysis on the spread of this virus using our industry-leading Applied Information Economics (AIE) methodology that incorporates probabilistic modeling to create actionable projections. The projections so far have tracked well with subsequently observed outcomes.

For example, we forecasted a 90% confidence interval for the number of total cases on the quarantined Diamond Princess cruise ship prior to the tests being conducted.  The figure below shows the forecast made 12 days before the tests were given and the outcome after test results were known. Note that the actual result was well within the forecasted range, and this result was repeated on multiple forecasts.

Reports are customizable by:

  • Frequency: Receive updates daily, weekly, or twice-weekly
  • Location: Choose the domestic or international locations you want to monitor and forecast
  • Timeframe: Determine how far out from the present you want to forecast (i.e. 7 days, 14 days, 30 days)
  • Delivery method: Tailor the content and method of the deliverables to what your decision-makers prefer
  • Optional consulting: Work with us to develop a more complete probabilistic model that can measure more variables and make additional forecasts to further quantify and mitigate operational risk

The result: actionable intelligence beyond what organizations have now through more accurate and more timely forecasts.

Only measuring the right things in the right way, and building a decision model to help inform better decisions, can move your organization ahead of the coronavirus curve.

Contact Us

schedule your consultation

15 + 14 =

Diamond Princess: A Data Science Solution To the COVID-19 Test Kit Shortage

Rarely does an opportunity present itself where statistics can so immediately and with so much impact solve a pressing real world problem. Shortly before publishing this post, we reached out and talked to the Japanese Ministry of Health and they indicated that they planned to test everybody on board. Whether they go ahead with that plan or not, the point of the article remains valid – doing a random sample (it could have been done 6 days ago) would be an efficient (both in terms of time and the limitation on test kits) way to reduce uncertainty on the total population of positive COVID-19 cases.

Situation: There are 3,600 passengers and crew aboard the Diamond Princess cruise ship docked off the coast of Yokohama, Japan. A significant percentage of them are infected with coronavirus, but it is unknown how many. Currently, it would be difficult to quickly test all 3,600 passengers and crew for the coronavirus, especially since there is limited availability of test kits, according to Japanese authorities.

Solution: To get a much better estimate of total cases, only a fraction of the passengers need to be tested at first. This could lead to important time savings in crucial decisions facing the Japanese Ministry of Health and the Diamond Princess cruise ship.

Despite the total number of 3600 passengers and crew, you only need to test a couple hundred to narrow the range meaningfully on the number of total cases; the results of those tests could have immediate and important consequences. A crucial tenet of Applied Information Economics (AIE) is that measurements are generally more useful (or have a higher ROI) when they are connected to a decision. The important decisions in this situation aren’t going to be based so much on a small difference (e.g. whether there are 200 or 220 additional cases). The important decisions will be made based on whether there are 50 or 500 additional cases. This level of uncertainty reduction could be achieved quickly with a smaller random sample of the whole population.

A crucial point is that these tests need to be selected randomly – thus far the samples have been taken from suspected cases (people with symptoms or contact with known cases). However, a random selection of 200 would allow us to apply an inverse beta distribution to the results and produce a relatively tight 90% confidence interval on total cases in the remaining 3,400 people.

Recommendation 1: Randomly test 70 staff and 130 passengers, and then use a beta distribution to project the total in the remaining population. The reason to break out staff and passengers is that they are likely to have different proportions of infection. Because the staff on the Diamond Princess continues to commingle (i.e. eat and berth together), their rate of infection is likely higher.

Recommendation 2: Once the new range for total infections is obtained with the random sample, prepare local hospitals for case load. Among other things, the ministry will know if there are enough isolation units available, and if not make other arrangements (i.e. dedicate one hospital to COVID-19 patients).

Recommendation 3: If the infection level of the staff is greater than a threshold (15-20%), then other arrangements should be made for serving passengers. Identifying the healthy staff would become a priority in this case.

At this moment, there is a wide range for the 90% confidence interval of current level of infections (https://hubbardresearch.com/cruise-ship-coronavirus-infected-passengers-in-hundreds/). People on board are worried about if they are sick or not, regardless of whether they have symptoms. If test results come back that indicate that a very small percentage of asymptomatic people tested positive, this would reassure those on board who are asymptomatic. Additionally, the percentage of asymptomatic cases that test positive could have broad global implications for detection and planning for we could back out percentage of cases that test positive while asymptomatic.

This is a unique opportunity to understand the disease that could help the effort to contain it worldwide!


Learn how to start measuring variables the right way – and create better outcomes – with our two-hour Introduction to Applied Information Economics: The Need for Better Measurements webinar. $100 – limited seating.


RECOMMENDED READING:

THE TOTAL NUMBER OF CORONAVIRUS-INFECTED CRUISE SHIP PASSENGERS WILL BE IN THE HUNDREDS [UPDATE]

Authorities have revealed the results of the first round of COVID-19 tests. But, a more impactful question remains: How many passengers will ultimately become infected?

THE DIAMOND PRINCESS QUARANTINE: USING A BETA DISTRIBUTION TO PREDICT INITIAL 2019 CORONAVIRUS INFECTIONS

The Diamond Princess cruise ship is currently under quarantine due to COVID-19. Here, we share lessons learned from applying our quantitative method.

Five Data Points Can Clinch a Business Case


Any decision can be made better through better measurements – and as these three examples show, just five data points can tip the scales in a business decision.

The Total Number of Coronavirus-Infected Cruise Ship Passengers Will Be in the Hundreds

Update: A new batch of test results was released on 2/15/2020, bringing the total number so far to 355 confirmed infections. The cruise ship has another week left in quarantine, and officials expect more cases to come – in line with our estimates (see below).

The Diamond Princess, a cruise ship carrying 3,700 passengers and crew, has been in quarantine ever since a passenger from Hong Kong fell ill with the 2019 novel coronavirus (2019 n-CoV). 

On 2/6/2020, we estimated that the total number of positive test results from the first 273 samples would be between 35 and 66. Today, 2/7/2020, the testing was completed and reported – and the number of samples that tested positive (61) fell within our estimated range (see Figure 1 below).

But, a more impactful question remains: How many passengers will ultimately become infected?

Today, 2/7/2020, we estimate the total number of coronavirus infections on the Diamond Princess as 150 to 850. We’ll explain the methodology we used to make this estimate, but the salient point is this: If the “hidden” population of the virus is large as we predict it holds important implications for policy makers (and the general public).

First, we’ll revisit our estimate from earlier this week. This estimate was made using a Beta distribution on the first 102 tests and applying it to the remaining 171 tests. (Figure 1).

Using a probabilistic model, we now give a 90% confidence interval for the total number of coronavirus infections on the Diamond Princess on 2/3/2020 as 150 to 550. Because infections could continue to occur between people in the same cabins after the quarantine, our 90% confidence interval for total infections before the quarantine is released is 150 to 850.

It is virtually impossible that the initial 61 are the only 2019 n-CoV cases on board the Diamond Princess. Why?

The answer is found in our article from 2/3/2020 – this disease has a long incubation period when people are asymptomatic but potentially infectious. This means there is likely a large group of people who are asymptomatic and not in the group of 273 but who do have the virus (Figure 2).

Figure 2: Projected date of first symptoms of 2019 n-CoV on Diamond Princess, given no infections after the 2/3/2020 quarantine. (No y-axis value is given since a wide range of total infections is possible).

Put another way, if one or two individuals could start a chain reaction on 1/21/2020 that created 61 symptomatic passengers by 2/2 – 12 days later – how many people would those symptomatic passengers have infected in the days before the quarantine? The answer to this question lies in knowing the average and distribution of the incubation period.

Using the Incubation Period to Estimate Asymptomatic Cases

The mean incubation period has been estimated in the New England Journal of Medicine as 5.2 days, with the 95th percentile of the distribution at 12.5 days. We are slightly troubled taking the values from these early cases as canonical (the same case study indicated a doubling time of 7.4 days which is clearly inconsistent with cases multiplying from 41 on 1/1/2020 to 32,000+ on 2/6/2020).

However, this is the best evidence based estimate we have, and it seems consistent with other (more recent) anecdotal cases where exposure and first symptom times are well known (such as cases 19-22 in Singapore). The NEJM incubation estimate is well described by a lognormal function with a mean of 1.425 and a standard deviation of 0.67 (Figure 3).

Figure 3: The incubation time described by the recent NEJM article is well modeled by a lognormal curve (mu=1.425 and sigma = 0.67

The Utility of Probabilistic Models

Given that 61 people were symptomatic with the coronavirus by 2/2 or 2/3, how do we calculate the total number infected before the quarantine? We do this with a Monte Carlo model – using the incubation time described above and solve for what the doubling interval would have to be to produce 56 to 61 symptomatic people by 2/2 or 2/3. It matters a great deal if the original group of 273 was selected on 2/2 to be tested or 2/3. This can be seen visually in Figure 2 (the proportion of the curve up to 2/2 is much smaller than to 2/3).

The best fit if the group was selected on 2/2 would be a doubling time of 1.33 days, implying 530 people would have been infected by the quarantine. If the group was selected on 2/3, the best fit doubling time would drop to 1.48 – implying a best guess of 275 people infected prior to the quarantine.

Additional Sources of Uncertainty

Note that 275 to 530 does not represent our 90% confidence interval. We would place about a 60% chance of certainty on that range. However, there are significant additional sources of uncertainty:

  1. Most importantly, the incubation could be significantly different than what the early evidence indicated. This could make the range go up or down.
  2. We don’t know the passenger from Hong Kong was the only one who had 2019 n-CoV. Other passengers could have had it or gotten infected early on in other ports. If so, this would make the range go down.
  3. If passengers on board are sharing rooms, there is the possibility for further infections after the quarantine started. If that occurs, this would make the final infection number go up.

The best-case scenario is that the tested group was symptomatic on 2/3/2020, that there was another source of coronavirus on board by 1/21/2020, that the true incubation is shorter, and that there were relatively few infections after the quarantine. In this case, the best estimate of infections would be around 150.

The worst-case scenario is if the tested group was symptomatic by 2/2/2020, there were no other cases of 2019 n-CoV on the ship on 1/21/2020, the true incubation period is longer, and there were significant infections of family members after the quarantine. In this case, the best estimate of infections would be around 850.

Therefore, our 90% confidence interval for all infected passengers before the ship is released, assuming the quarantine is maintained, is between 150 and 850.

Drawing the Right Conclusions

Here, it’s important to provide a non-quantitative side-note. The people who are sick or quarantined on the ship are not numbers on a page – they are real people who are facing a difficult trial. My thoughts go out to these people, and my gratitude to the cruise operators and all the medical and support staff that are helping in this situation. May they be given strength and not fear their situation; may the sick passengers be comforted by the knowledge that Japan has great medical services and there are hopeful signs regarding treatment.

Additionally, it is important that other passengers draw the correct conclusions if additional cases are found in the coming days. Panic is not the best response. In fact, part of the motivation to write this article is to point out that we should all assume there will be reports of additional cases of people who were infected before the quarantine. This is crucial, and my hope is that this message can find its way to the passengers to prevent further unnecessary worry.

Macro Implications

There are potentially valuable implications that come out of this extremely unfortunate situation. This may provide a stark illustration of the hidden population of 2019 n-CoV – although only 61 people were symptomatic on 2/3/2020, there were likely hundreds already infected. This estimate, if correct, is vital to the understanding of policymakers and how the outbreak needs to be handled.

Also, I believe that we should avoid condemning the quarantine as ineffective and should not unnecessarily scapegoat the Diamond Princess staff or Carnival policies. In no way do I intend this to be “apologist” – rather let’s draw the correct conclusions from the data and not give in to emotional but incorrect reasoning.

More importantly, if the “hidden” population of asymptomatic infected people is significantly larger than the population of known cases, then the idea of “best practice” currently adopted in countries other than China may need to change. At this point, we aren’t willing to speculate what those changes might be, but it is worth starting to think about. We will learn a lot by the rate of infection revealed on the cruise ship over the next 7-10 days. Roughly 90% of those infected on or before 2/2/2020 should be symptomatic by 2/10/2020, so we should have a good idea of the total number within a week.


Learn how to start measuring variables the right way – and create better outcomes – with our two-hour Introduction to Applied Information Economics: The Need for Better Measurements webinar. $100 – limited seating.


RECOMMENDED READING:

TROJAN HORSE: HOW A PHENOMENON CALLED MEASUREMENT INVERSION CAN MASSIVELY COST YOUR COMPANY

Measuring the wrong variables is a Trojan horse that infiltrates virtually every organization. This phenomenon has a real cost that can be measured – and avoided.

TWO WAYS YOU CAN USE SMALL SAMPLE SIZES TO MEASURE ANYTHING

A measurement isn’t useless if the sample size is small. You can actually use small sample sizes to learn something useful about anything – and use that insight to make better decisions.

Five Data Points Can Clinch a Business Case

Any decision can be made better through better measurements – and as these three examples show, just five data points can tip the scales in a business decision.


The Diamond Princess Quarantine: Using a Beta Distribution to Predict Initial 2019 Coronavirus Infections

The Diamond Princess cruise ship is currently under quarantine while 271 passengers are being tested (as of 2/5/2020) for the 2019 novel coronavirus (2019 n-CoV). Concern about infection arose when a prior passenger from Hong Kong who was on board the ship from 1/20 to 1/25 was later found to be infected. As a result, the ship was delayed and then quarantined off the port of Yokohama to test a group of 271 passengers who either had symptoms of 2019 n-CoV or had significant contact with the original case from Hong Kong. On Wednesday (2/5) 10 out of 31 tests had come back positive from a suspected 271 people. By Thursday, 20 out of 102 tests had come back positive. This is a real world application where we can test the utility of a Beta distribution to predict an outcome – we shouldn’t be surprised if another 15-46 people test positive for the coronavirus out of the remaining tests. 

A Beta distribution for the first 31 tests would have an alpha of 11 (10+1) and a beta of 22 (21+1); the 90% confidence interval for the proportion using the first sample is 21%-47% (Figure 1). The second group of tests has an alpha of 11 (10+1) and a beta of 62 (61+1); the 90% confidence interval for the proportion given this sample is 9%-22% (Figure 1). Based on these results, we suspect that they tested the more likely cases first, and the remaining 169 are more likely to resemble the second sample in likelihood of infection. However, if the first two samples were randomly selected then we would use the beta distribution of all 102 initial cases (alpha = 21, beta = 83) with a 90% C.I. of 14 to 27%.

coronavirus estimates

Figure 1: Difference in distributions between the first and second sets of test results

Since we don’t know which is accurate, we’ll use 9-27% for our 90% confidence interval, which gives us an estimate of 35 to 66 total of this group of 271 will test positive for the coronavirus (Figure 2). This would imply that an additional 15 to 46 positive results will come back from the remaining 169 tests.

Figure 2: Predictions for the lower bound and upper bound of test results for the 271 suspected cases aboard the Diamond Princess


Drawing the Right Conclusions

There is another chapter to this story however. Whether the original group has 35 or 66 cases, these will not be the only 2019 n-Cov cases on board the Diamond Princess cruise ship, and it is crucial that policy makers understand why. The ship has nearly 3,700 people trapped on board, and the infection spread uninhibited for at least seven days. The correct conclusion is that the incubation period is long, and the doubling rate is short – therefore when these initial 271 passengers were selected and tested, there already existed another group of people who were infected and not symptomatic. This is important for three reasons:

  1. Don’t blame the quarantine. As additional cases are found over the next 10 days, it would be incorrect to assume that quarantining people to their rooms failed. That was the correct move and will prevent additional infections and serious illness.

  2. The “hidden population” of 2019 n-Cov is a crucial aspect of understanding this disease. This was the main point in the post published on Monday – that the undercount of this disease will hamper attempts to control the spread because of the long incubation period and asymptomatic cases. If policy-makers can draw the right conclusions from the Diamond Princess experience, it could dramatically help in the effort to slow or stop the spread of the disease.

  3. It is likely that additional cases may have gotten off the ship between 1/20 and 2/2, and those passengers should be alerted and local health officials made aware of the risk.

We will publish a follow up article to this once the test results for the 271 passengers are completed. Our initial estimates are that at least 100 people will test positive before the quarantine is released. We estimate that even if quarantine efforts prove perfectly successful, the Diamond Princess will likely have over 100 people aboard the ship test positive for 2019 n-Cov before the quarantine is released.


Learn how to start measuring variables the right way – and create better outcomes – with our two-hour Introduction to Applied Information Economics: The Need for Better Measurements webinar. $100 – limited seating.


RECOMMENDED READING:

TROJAN HORSE: HOW A PHENOMENON CALLED MEASUREMENT INVERSION CAN MASSIVELY COST YOUR COMPANY

Measuring the wrong variables is a Trojan horse that infiltrates virtually every organization. This phenomenon has a real cost that can be measured – and avoided.

TWO WAYS YOU CAN USE SMALL SAMPLE SIZES TO MEASURE ANYTHING

A measurement isn’t useless if the sample size is small. You can actually use small sample sizes to learn something useful about anything – and use that insight to make better decisions.

Five Data Points Can Clinch a Business Case

Any decision can be made better through better measurements – and as these three examples show, just five data points can tip the scales in a business decision.


7 Simple Principles for Measuring Anything

measuring anything


If you want to make better decisions, using data to inform your decision-making is the way to go. Organizations largely understand this reality in principle, if not always in practice. But it’s not enough to just gather data; you have to know how to use it, and unfortunately, most organizations don’t.

Fortunately, quantitative analysis doesn’t have to be that difficult. We’ve found over the decades that much of what interferes with data-driven decision-making is confusion, misunderstanding, and misconceptions about measurement in general. As our work with leading public and private entities across the globe has proven, these obstacles can be overcome. Anything can be measured, and if you can measure it, you can improve your decisions.

Below are seven simple principles for making better measurements that form the basis of our methodology, Applied Information Economics (AIE), and – if applied – can quickly improve the quality of the decisions you make (Figure 1).

Figure 1: 7 Simple Rules for Measuring Anything – Hubbard Decision Research

7 Simple Rules for Measuring Anything – Hubbard Decision Research


Rule 1: If It Matters, It Can Be Measured

Nothing is impossible to measure. We’ve measured concepts that people thought were immeasurable, like customer/employee satisfaction, brand value and customer experience, reputation risk from a data breach, the chances and impact of a famine, and even how a director or actor impacts the box office performance of a movie. If you think something is immeasurable, it’s because you’re thinking about it the wrong way.

Put simply:

  1. If it matters, it can be observed or detected.
  2. If it can be detected, then we can detect it as an amount or in a range of possible amounts.
  3. If it can be detected as a range of possible amounts, we can measure it.

If you can measure it, you can then tell yourself something you didn’t know before. Case in point: the Office of Naval Research and the United States Marine Corps wanted to forecast how much fuel would be needed in the field. There was a lot of uncertainty about how much would needed, though, especially considering fuel stores had to be planned 60 days in advance. The method they used to create these forecasts was based on previous experience, educated assumptions, and the reality that if they were short on fuel, lives could be lost. So, they had the habit of sending far more fuel to the front than they needed, which meant more fuel depots, more convoys, and more Marines in harm’s way.

After we conducted the first round of measurements, we found something that surprised the Marines: the biggest single factor in forecasting fuel use was if the roads the convoys took were paved or gravel (figure 1).

Figure 1: Average Changes in Fuel

We also found that the Marines were measuring variables that provided a lot less value. More on that later.

Rule 2: You Have More Data Than You Think

Many people fall victim to the belief that to make better decisions, you need more data – and if you don’t have enough data, then you can’t and shouldn’t measure something.

But you actually have more data than you think. Whatever you’re measuring has probably been measured before. And, you have historical data that can be useful, even if you think it’s not enough.

It’s all about asking the right questions, questions like;

  • What can email traffic tell us about teamwork?
  • What can website behavior tell us about engagement?
  • What can publicly available data about other companies tell us about our own?

Similarly…

Rule 3: You Need Less Data Than You Think

Despite what the Big Data era may have led you to believe, you don’t need troves and troves of data to reduce uncertainty and improve your decision. Even small amounts of data can be useful. Remember, if you know almost nothing, almost anything will tell you something.

Rule 4: We Measure to Reduce Uncertainty

One major obstacle to better quantitative analysis is a profound misconception of measurement. For that, we can blame science, or at least how science is portrayed to the public at large. To most people, measurement should result in an exact value, like the precise amount of liquid in a beaker, or a specific number of this, that, or the other.

In reality, though, measurements don’t have to be that precise to be useful. The key purpose of measurement is to reduce uncertainty. Even marginal reductions in uncertainty can be incredibly valuable.

Rule 5: What You Measure Most May Matter Least

What if you already make measurements? Let’s say you collect data and have some system – even an empirical, statistics-based quantitative method – to make measurements. Your effectiveness may be severely hampered by measuring things that, at the end of the day, don’t really matter.

By “don’t really matter,” we mean that the value of these measurements – the insight they give you – is low because the variable isn’t very important or isn’t worth the time and effort it took to measure it.

What we’ve found is a bit unsettling to data scientists: some of the things organizations currently measure are largely irrelevant or outright useless – and can even be misleading. This principle represents a phenomenon called “measurement inversion” (Figure 2):

measurement problems

Figure 2: Measurement Inversion – Hubbard Decision Research

Unfortunately, it’s a very common phenomenon. The Marine Corps fell victim to it with their fuel forecasts. They thought one of the main predictors of fuel use for combat vehicles like tanks and Light Armored Vehicles (LAV) was the chance that they would make contact with the enemy. This makes sense; tanks burn more fuel in combat because they move around a lot more, and their gas mileage is terrible. In reality, though, that variable didn’t move the needle that much.

In fact, the more valuable predictive factor was whether or not the combat vehicle had been in a specific area beforeIt turns out that vehicle commanders, when maneuvering in an uncertain area (i.e. landmarks, routes, and conditions in that area they had never encountered before), tend to keep their engines running for a variety of reasons. That burns fuel.

(We also discovered that combat vehicle fuel consumption wasn’t as much of a factor as convoy vehicles, like fuel trucks, because there were less than 60 tanks in the unit we analyzed. There were over 2,300 non-combat vehicles.)

Rule 6: What You Measure Least May Matter Most

Much of the value we’ve generated for our clients has come through measuring variables that the client thought were either irrelevant or too difficult to measure. But often, these variables provide far more value than anyone thought!

Fortunately, you can learn how to measure what matters the most. The chart below demonstrates some of the experiences we’ve had with combating this phenomenon with our clients (Figure 3):

measurement inversion examples

Figure 3: Real Examples of Measurement Inversion – Hubbard Decision Research

This isn’t to say that the variables you’re measuring now are “bad.” What we’re saying is that uncertainty about how “good” or “bad” a variable is (i.e. how much value they have for the predictive power of the model) is one of the biggest sources of error in a model. In other words, if you don’t know how valuable a variable is, you may be making a measurement you shouldn’t – or may be missing out on making a measurement you should.

Rule 7: You Don’t Have to Beat the Bear

When making measurements, the best thing to remember is this: If you and your friends are camping, and suddenly a bear attacks and starts chasing you, you don’t have to outrun the bear – you only have to outrun the slowest person.

In other words, the quantitative method you use to make measurements and decisions only has to beat the alternative. Any empirical method you incorporate into your process can improve it if it provides more practical and accurate insight than what you were doing before.

The bottom line is simple: Measurement is a process, not an outcome. It doesn’t have to be perfect, just better than what you use now. Perfection, after all, is the perfect enemy of progress.

Incorporate these seven principles into your decision-making process and you’re already on your way to better outcomes.


Learn how to start measuring variables the right way – and create better outcomes – with our two-hour Introduction to Applied Information Economics: The Need for Better Measurements webinar. $100 – limited seating.


RECOMMENDED READING:

GOING BEYOND THE USUAL SUSPECTS IN COMMERCIAL REAL ESTATE MODELING: FINDING BETTER VARIABLES AND METHODS

Commercial real estate modeling is becoming more widespread, but is still limited in several crucial  ways.

ESTIMATING THE TRUE NUMBER OF INFECTIONS OF THE 2019 NOVEL CORONAVIRUS

Is the number of people infected by Covid-19 being underreported? Here’s why we think that may be the case – to a significant degree.


WHAT THE MANHATTAN PROJECT AND JAMES BOND HAVE IN COMMON - AND WHY EVERY ANALYST NEEDS TO KNOW IT

Decisions aren’t made in a vacuum. They’re made in real life, and the best way to simulate the randomness in real life is through this powerful tool.

Estimating the True Number of Infections of the 2019 Novel Coronavirus: Reasons for Potentially Massive Underreporting

wuhan coronavirus analysis

There is good reason to believe that the number of the 2019 novel coronavirus- or 2019-nCoV – infections worldwide may be much greater than what has been reported so far.  As of Tuesday, February 3, 2020, at 8:00am CST (UTC-6) the Johns Hopkins coronavirus tracking map shows there are 17,489 confirmed inflections.   Of course, even in the best reporting systems, augmented with the fastest diagnoses, any number of reported infections would almost certainly be too low.  However, our analysis points to a number of infections that may be in the hundreds of thousands, or possibly over one million – far above the latest official numbers.

Many informative analyses already exist on this outbreak, and it was relatively easy to build a model that accurately predicts the next few days of deaths and reported infections (Figure 1).

wuhan flu coronavirus

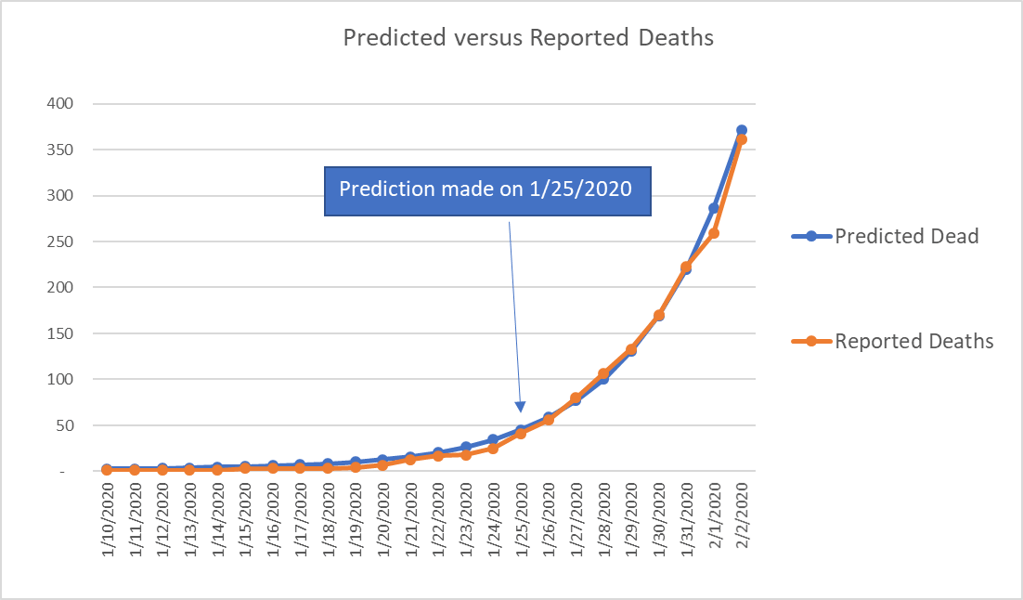
Figure 1: Prediction made on 1/25/2020 using a naïve exponential growth (daily) of 0.26 and a probability distribution function for time to death based off initial data. (http://www.nhc.gov.cn/yjb/s3578/202001/5d19a4f6d3154b9fae328918ed2e3c8a.shtml).

There is much more uncertainty regarding the total number of cases and infections. This number is crucial because it can inform the international community in terms of expected cases. The number of expected cases then informs decision-making and resource allocation from governments and non-governmental organizations (NGOs) to combat the spread. Too much uncertainty in either direction – overestimating versus underestimating – can result in efforts that are inefficient at best and ineffective or even harmful at worst.

While articles already exist that put the number of total cases at 75,000, we believe there is still a crucial distinction that hasn’t been incorporated: the incubation time and exponential growth of the virus, which can make the infections an order of magnitude higher than the symptomatic cases.

If the calculations in this article are correct, then there are already dozens of cases of 2019-nCoV in the United States, many of which will go undetected.

We support these assertions using two different methods of calculation, both of which depend, in part, on the fact that the average time to death from infection is long (25 days or greater on average, based on initial data). These calculations also depend on the observations that the average time from becoming infected to going to the hospital is 10-15 days; that only 20% of those infected ever require hospitalization; and that average time from hospitalization to death is relatively long (12 to 18 days).

Based on these calculations, we encourage world citizens and governments to all act now to prepare for a world-wide pandemic.

We begin by stating the summary of concerns:

  1. 2019-nCoV is not like the seasonal flu – it is more contagious, has a longer incubation period, has a much higher rate of serious complications (ICU bed requirement), and is deadlier, with a fatality rate that is five to 30 times higher.
  2. Curious patterns in the data indicate the possibility of massive underreporting.
    a. This could partly due to the characteristics of the disease itself – a long incubation period and significant period of time from initial
    symptoms to the development of more serious symptoms.
    b. It could also be due in part to human systems for detecting the disease. Even assuming competence and best intentions, there are factors                       that will contribute to under-reporting in the early parts of an epidemic and during the period of exponential growth.

We remain impartial regarding whether China is intentionally misrepresenting data. Regardless, social media videos out of China on 1/23/2020 appear to indicate a gap between what was reported and what was actually occurring on the ground in the Wuhan province. Keep in mind that at the time China had reported only 21 deaths, while Wuhan was treating coronavirus in 20+ hospitals. While the baseline for hospitals in China may be more chaotic then Europe or the US, the videos do not appear to be consistent with something less impactful than the seasonal flu. Here is a scene from one of those Wuhan hospitals on 1/23/2020.

The Importance of Symptomatic Vs. Infected

As we mentioned, organizations across the globe are rushing to provide analysis and understanding. What we haven’t seen yet in any analysis, however, is a sobering realization: that the length of time from infection to death implies a number of infections that is two orders of magnitude higher than the current reports.

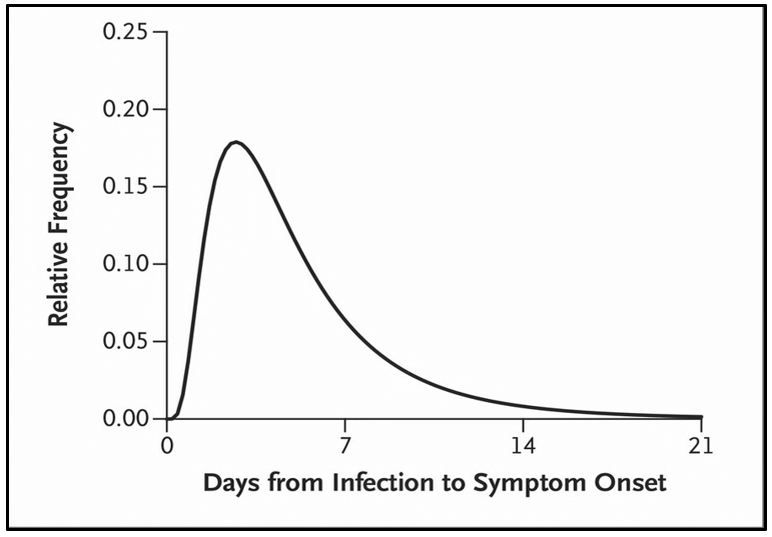
The lengthy incubation period represents a lag between the time someone becomes infected by the virus and when they begin to show symptoms. The incubation period for the common cold is anywhere from 24 to 72 hours; for the garden-variety flu, it’s two days on average. The incubation period for the Spanish flu, the deadliest pandemic in the history of the world after the Black Death, had an incubation period of two to seven days.

2019-nCoV, by contrast, has an incubation period that lasts an average of five to 10 days.

Incubation periods matter because the longer infected persons go without showing symptoms, the longer they go without seeking care and the more people they expose to the pathogens they carry inside of them. Calculating the number of people who have shown symptoms of 2019-nCoV, then, carries the risk of grossly undercounting the number of people who are actually infected.

A compelling picture of this issue is illustrated by comparing the number of infections and the number of symptomatic cases (Figures 2-4).

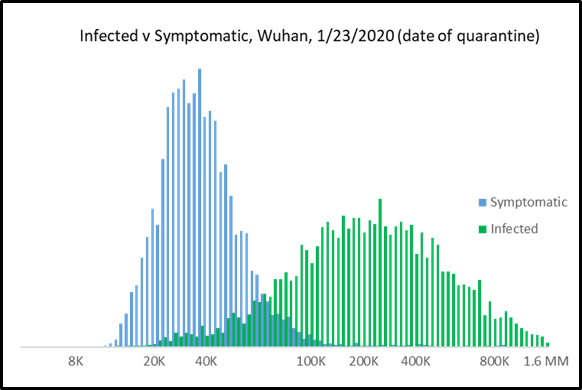
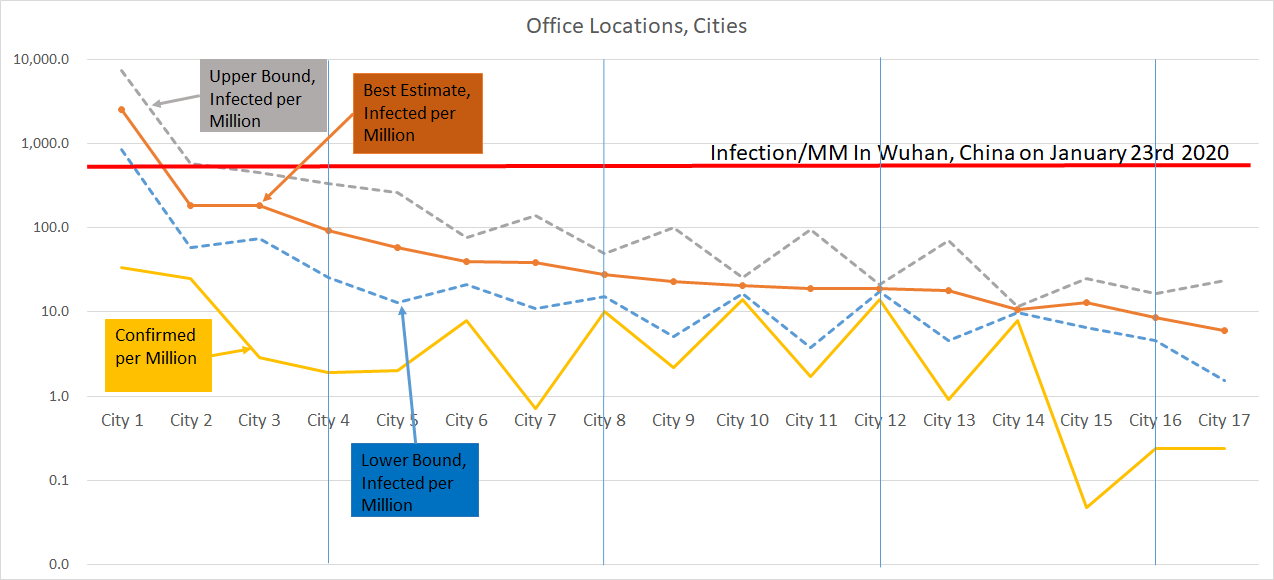
Figure 2: Monte Carlo Simulation results illustrating difference between infected and symptomatic cases (log scale).

Below we include individual histograms for both infections and symptomatic cases that illustrate the difference between reported cases, calculations based on current international symptomatic cases, and our calculations based on a Monte Carlo model that incorporates the incubation period. Note the scale on infections (Figure 4) is 10-15 times larger than the scale on symptomatic cases (Figure 3).

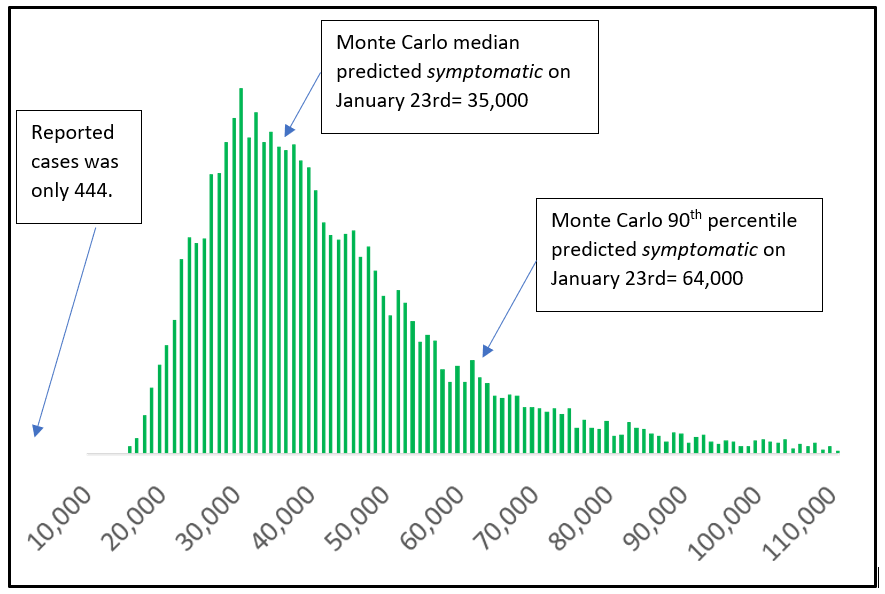
Figure 3: Symptomatic Cases of 2019-nCoV in Wuhan on Jan 23rd (histogram of 10,000 trials of a Monte Carlo model).

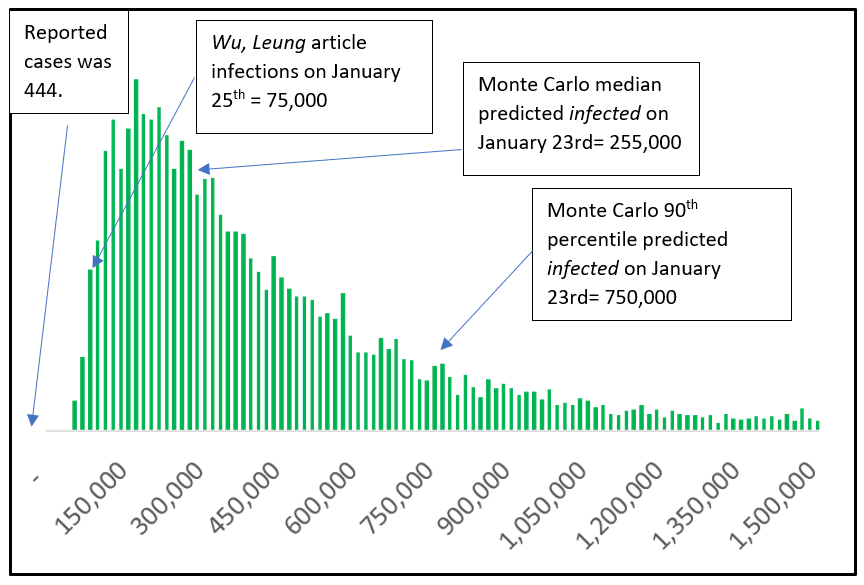
Figure 4: Infections of 2019-nCoV in Wuhan on Jan 23rd (histogram of 10,000 trials of a Monte Carlo model).

Even Thursday’s Lancet paper, which is backing out 75,000 Wuhan infections as of 1/25/2020 is low for the same reason – they are using international “infections” as their starting point and observing it is an unrealistic number given a mere 3,300 daily international passengers out of Wuhan before the quarantine. But the results are likely low because of the nature of growth and long incubation period of this virus – they can only count the “symptomatic” international cases – not the infected international cases.

How Lagging Indicators Obscure Reality

Sometimes, our understanding of the actual magnitude of an event, like a pandemic, is limited by the fact that even in the best of circumstances, data often lags behind the pace of reality.

Based on the published case history of the first 17 deaths occurring from 2019-nCoV, the average time from infection to death is 22-35 days (1-14 days for incubation, five days from onset of symptoms to hospitalization, and 12-18 days from hospitalization to death). In addition, only 20% of those infected ever require hospitalization.

We also have the epidemiological reality that time to death is always underrepresented during the exponential growth phase of an epidemic because the people who take a long time to die haven’t died yet.

The implications of this long time from infection to death makes it difficult for the public to comprehend, during the early stages, the stunning nature of the implied exponential growth in cases.

Put another way, the situation could very well be worse than we believe because we expect the numbers we receive in the news to be closer to the truth than what they really are: a snapshot of the past that grows older and more obsolete at a dizzying pace.

To be conservative, let us assume that the average time to death from infection is 25 days (the Monte Carlo simulations with the best fit to deaths is 29 days from infection to death). This implies that, given a 2.5% fatality rate, and that 362 people have died, there were 14,480 cases 25 days ago. Stated otherwise, given that it takes 25 days to die from infection, 14,480 were infected as of 1/9/2020! (At the time, the official number of confirmed cases was just 41.)

Combine this with a fearsome exponential growth from 1/9/2020 until the quarantine on 1/23/2020 and one starts to get the picture.

Shedding Light on Exponential Growth Rates with Probabilistic Models: How Many People Are Really Infected?

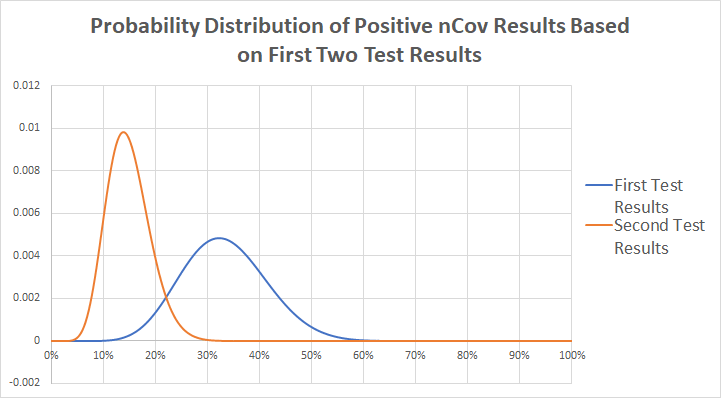
We still can’t make a definitive estimate of exponential growth, in part, because it changes over time as behaviors change. However, the beauty of a probabilistic model, one using initially wide ranges for variables, is that we can quickly discern certain values of variables that are unrealistic. In other words, the model can rapidly narrow the wide amount of uncertainty we have about a given variable (i.e. infection rates).

Using this method, we have concluded that the unrestrained (i.e., before quarantine) log growth rate of 2019-nCoV is at least 0.26 and as high as 0.31. This implies a doubling time in the initial stages of the outbreak of between 2.3 and 2.7 days – far less than other published estimates. A shorter doubling time represents the virus spreading faster among a given population. When coupled with the other observations the international community has gathered about the virus, the models give us a range of likely outcomes that reduce the uncertainty to as much as possible given what we know now.

The results are disquieting. Our best estimates for current infections are 800,000 in Hubei/Wuhan and 337,000 in the rest of China (Table 1).

wuhan flu predicted infections deaths

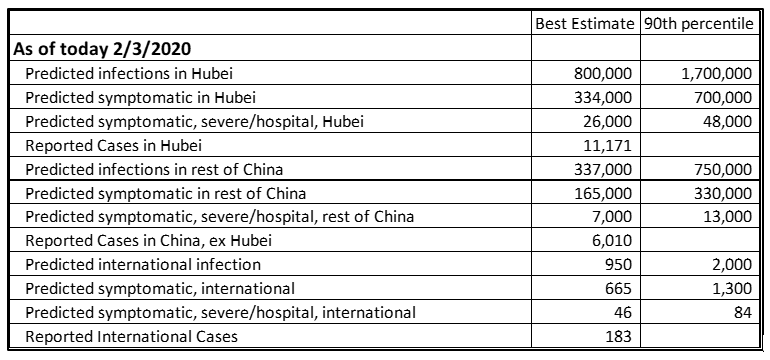
Table 1: Monte Carlo predictions for current levels of 2019-nCoV in Hubei, China ex Hubei, and International.

How Could This Be?

Skeptics at this point will say, “How could 1,000,000 people in Wuhan be sick? That would imply that every 8th person was sick and that would be all over the media!”

First, there has been very little reporting out of Wuhan in the last week. Governments at all levels have moved to restrict access into and out of the quarantine zone, leaving first-hand news via uncontrolled sources in scant supply.

Second, there is a big difference between 1,000,000 infected and 1,000,000 sick. Because the incubation period is so long, even if 1,000,000 were infected, only a few hundred thousand might be symptomatic.

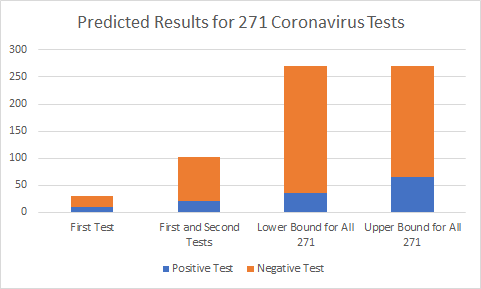
Skeptics might still say, “How could even 300,000 be sick when the official number is only 11,000?” Recall that the average time from becoming symptomatic to going to the hospital is five days, and that only 20% ever require hospitalization. That means only 60,000 of those 300,000 will require hospitalization. Add in the average lag between being symptomatic and hospitalization, and physical limitations at hospitals, and 11,000 is a very reasonable number of reported cases.

Therefore, it is entirely believable that 1,000,000 people are infected with 2019-nCoV as of 2/3/2020, and with 500,000 infections realized before the time the quarantine was in place on 1/23/2020.

If this is true, then at least 200 infected people flew to international destinations before the quarantine, and 75,000 infected people traveled to domestic Chinese destinations before the quarantine. Given the exponential rate of growth discussed previously, it is possible – perhaps likely – that the original Wuhan quarantine was too little, too late to keep the pandemic from spreading.

Implications for Mainland China

The bad news is that given there are likely hundreds of thousands of infections in China, it is unlikely that China will be “open for business” in the next month – possibly even the next several months. Undoubtedly, the unprecedented quarantine and public health measures China has taken will have reduced the log growth rate of new cases. However, because of the long incubation time and the uncertainty around reporting, we will have wide error bars around our estimate of the new rate of growth for several weeks.

Implications for Other Countries

Given how contagious the disease is, and the continued free flow of international travel from other Chinese ports up through 2/1/2010, an international pandemic likely at this point.

However, there is reason to be encouraged by the international response thus far. The numbers of reported and predicted infections are relatively low, and many people with the virus have largely self-quarantined, which helps tremendously.

The biggest issue is that our sample of infected people is going to be skewed toward the responsible people. Responsible actors will appear in reports; less responsible actors may not. People who have visited China in January and don’t self-quarantine, or who display very moderate symptoms, could slip through the cracks. There is already evidence that infected people with few symptoms can infect clusters of people. The possibility for an epidemic in another country comes if these clusters aren’t immediately caught.

How might this happen? Here is an actual story that has already been reported. An older couple from Wuhan visited their daughter in Shanghai some time during the week before 1/15/2020. They were infected with 2019-nCoV; the daughter soon caught it as well. The daughter then flew to Germany on the 15th and spent a week with colleagues before returning to Shanghai on 1/22/2020. She only became symptomatic after leaving Germany, but had infected several Germans before doing so.

What Do I Do?

Hope is not a good strategy to mitigate risk. While positive interpretations of the data exist, counting on that to be reality sets us up to repeat the initial mistakes in early January to contain and mitigate the virus.

Most humans don’t like to think about things like this because cold, uncompromising reality is uncomfortable, forcing us to decide to either change our habits or face the possibility of disease or death. Nevertheless, making rational decisions to protect yourself based on a sound statistical and logical analysis has helped many millions of lives in the course of human history.

Our recommendation is that we directly address the issue that the current and eventual spread and magnitude of the outbreak could be worse than we believe or imagine, bearing in mind that it is possible we may only have a few days before outbreaks start popping up in the U.S. and possibly just weeks before a general epidemic begins stateside.

Part of the resistance to thinking about pandemics is that it is easy (but incorrect) to assume that we are powerless to affect the outcome. Here are three easy things we can do on a personal level:

  • Wash our hands. This isn’t as easy as it sounds – it means creating a new habit where we wash or disinfect our hands whenever we’ve contacted a public surface (grocery cart, bathroom door handle, etc.). Disinfecting helps. Washing and scrubbing with soap for 15 seconds is the formal protocol.
  • Some published research shows that elderberry syrup may reduce the severity of other types of flu viruses and reduce the probability of transmission.
  • If there is a cluster or outbreak in your city, minimize or avoid public gatherings and wear protective facemasks in public. This is probably the most difficult one because it comes at a high social cost some people aren’t willing to pay.

Preparations for Your Business

If you’d like help preparing your business for the possibilities, there are certain practices you can adopt now that will give you an advantage regardless of outcome (such as reviewing your capabilities for remote work). Also, if you’d like to use or test scenarios on the Monte Carlo model we created, please contact us. One of the advantages of using a probabilistic model is that you can update the uncertainty in real time and always know what contingencies you need to put in place for the most likely scenarios.

Matt Millar is a senior quantitative analyst with Hubbard Decision Research. Contact Matt for more information on this article or any of the methods discussed wherein.


RECOMMENDED READING:

TROJAN HORSE: HOW A PHENOMENON CALLED MEASUREMENT INVERSION CAN MASSIVELY COST YOUR COMPANY

Measuring the wrong variables is a Trojan horse that infiltrates virtually every organization. This phenomenon has a real cost that can be measured – and avoided.

TWO WAYS YOU CAN USE SMALL SAMPLE SIZES TO MEASURE ANYTHING

A measurement isn’t useless if the sample size is small. You can actually use small sample sizes to learn something useful about anything – and use that insight to make better decisions.

Five Data Points Can Clinch a Business Case

Any decision can be made better through better measurements – and as these three examples show, just five data points can tip the scales in a business decision.