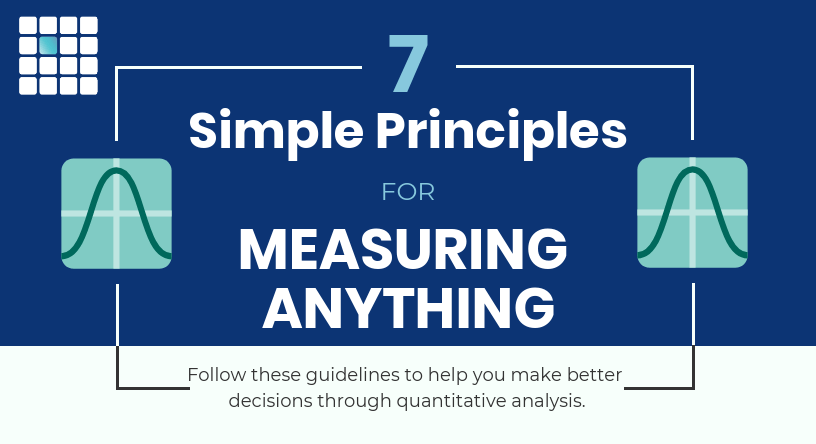
7 Simple Principles for Measuring Anything

measuring anything


If you want to make better decisions, using data to inform your decision-making is the way to go. Organizations largely understand this reality in principle, if not always in practice. But it’s not enough to just gather data; you have to know how to use it, and unfortunately, most organizations don’t.

Fortunately, quantitative analysis doesn’t have to be that difficult. We’ve found over the decades that much of what interferes with data-driven decision-making is confusion, misunderstanding, and misconceptions about measurement in general. As our work with leading public and private entities across the globe has proven, these obstacles can be overcome. Anything can be measured, and if you can measure it, you can improve your decisions.

Below are seven simple principles for making better measurements that form the basis of our methodology, Applied Information Economics (AIE), and – if applied – can quickly improve the quality of the decisions you make (Figure 1).

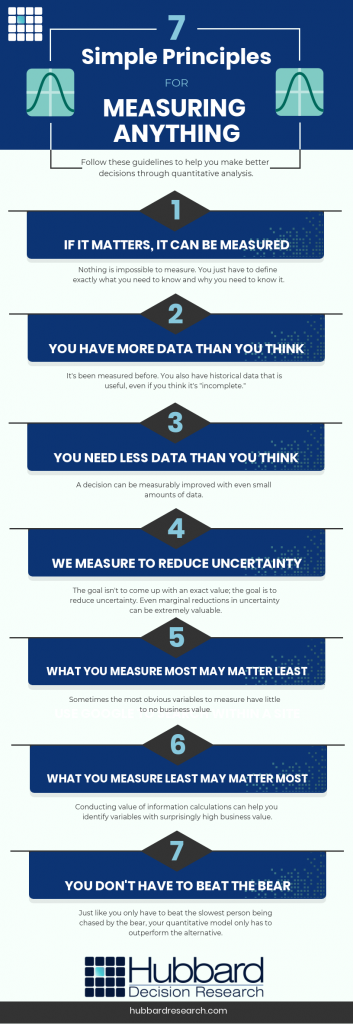
Figure 1: 7 Simple Rules for Measuring Anything – Hubbard Decision Research

7 Simple Rules for Measuring Anything – Hubbard Decision Research


Rule 1: If It Matters, It Can Be Measured

Nothing is impossible to measure. We’ve measured concepts that people thought were immeasurable, like customer/employee satisfaction, brand value and customer experience, reputation risk from a data breach, the chances and impact of a famine, and even how a director or actor impacts the box office performance of a movie. If you think something is immeasurable, it’s because you’re thinking about it the wrong way.

Put simply:

  1. If it matters, it can be observed or detected.
  2. If it can be detected, then we can detect it as an amount or in a range of possible amounts.
  3. If it can be detected as a range of possible amounts, we can measure it.

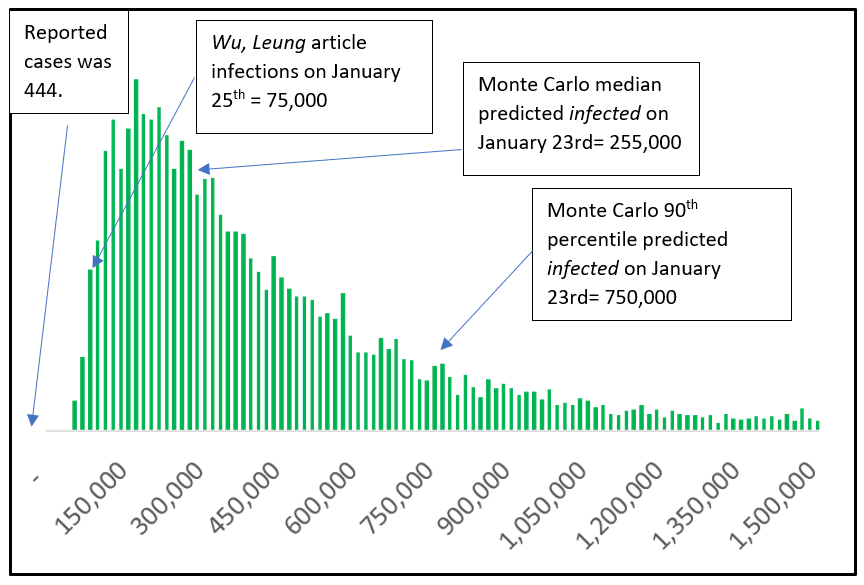
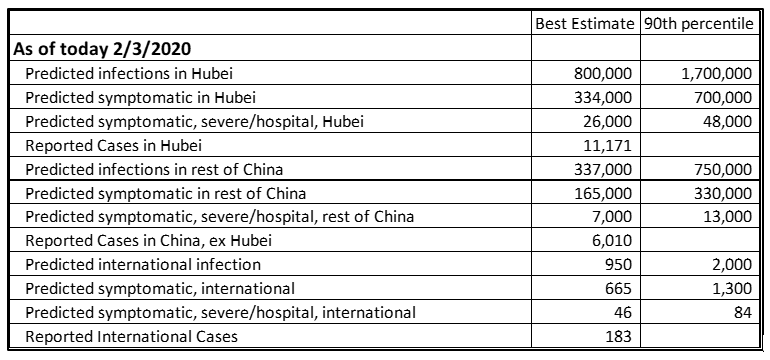
If you can measure it, you can then tell yourself something you didn’t know before. Case in point: the Office of Naval Research and the United States Marine Corps wanted to forecast how much fuel would be needed in the field. There was a lot of uncertainty about how much would needed, though, especially considering fuel stores had to be planned 60 days in advance. The method they used to create these forecasts was based on previous experience, educated assumptions, and the reality that if they were short on fuel, lives could be lost. So, they had the habit of sending far more fuel to the front than they needed, which meant more fuel depots, more convoys, and more Marines in harm’s way.

After we conducted the first round of measurements, we found something that surprised the Marines: the biggest single factor in forecasting fuel use was if the roads the convoys took were paved or gravel (figure 1).

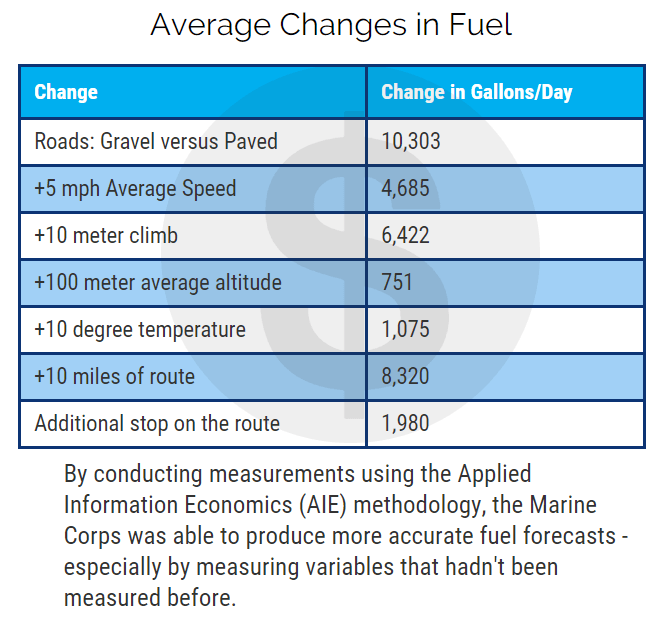
Figure 1: Average Changes in Fuel

We also found that the Marines were measuring variables that provided a lot less value. More on that later.

Rule 2: You Have More Data Than You Think

Many people fall victim to the belief that to make better decisions, you need more data – and if you don’t have enough data, then you can’t and shouldn’t measure something.

But you actually have more data than you think. Whatever you’re measuring has probably been measured before. And, you have historical data that can be useful, even if you think it’s not enough.

It’s all about asking the right questions, questions like;

  • What can email traffic tell us about teamwork?
  • What can website behavior tell us about engagement?
  • What can publicly available data about other companies tell us about our own?

Similarly…

Rule 3: You Need Less Data Than You Think

Despite what the Big Data era may have led you to believe, you don’t need troves and troves of data to reduce uncertainty and improve your decision. Even small amounts of data can be useful. Remember, if you know almost nothing, almost anything will tell you something.

Rule 4: We Measure to Reduce Uncertainty

One major obstacle to better quantitative analysis is a profound misconception of measurement. For that, we can blame science, or at least how science is portrayed to the public at large. To most people, measurement should result in an exact value, like the precise amount of liquid in a beaker, or a specific number of this, that, or the other.

In reality, though, measurements don’t have to be that precise to be useful. The key purpose of measurement is to reduce uncertainty. Even marginal reductions in uncertainty can be incredibly valuable.

Rule 5: What You Measure Most May Matter Least

What if you already make measurements? Let’s say you collect data and have some system – even an empirical, statistics-based quantitative method – to make measurements. Your effectiveness may be severely hampered by measuring things that, at the end of the day, don’t really matter.

By “don’t really matter,” we mean that the value of these measurements – the insight they give you – is low because the variable isn’t very important or isn’t worth the time and effort it took to measure it.

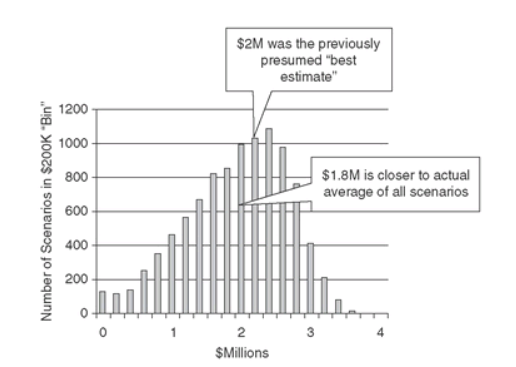
What we’ve found is a bit unsettling to data scientists: some of the things organizations currently measure are largely irrelevant or outright useless – and can even be misleading. This principle represents a phenomenon called “measurement inversion” (Figure 2):

measurement problems

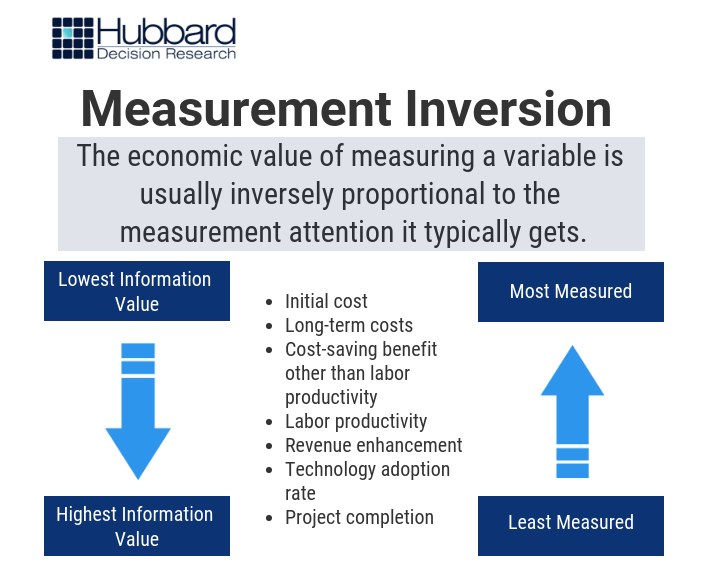
Figure 2: Measurement Inversion – Hubbard Decision Research

Unfortunately, it’s a very common phenomenon. The Marine Corps fell victim to it with their fuel forecasts. They thought one of the main predictors of fuel use for combat vehicles like tanks and Light Armored Vehicles (LAV) was the chance that they would make contact with the enemy. This makes sense; tanks burn more fuel in combat because they move around a lot more, and their gas mileage is terrible. In reality, though, that variable didn’t move the needle that much.

In fact, the more valuable predictive factor was whether or not the combat vehicle had been in a specific area beforeIt turns out that vehicle commanders, when maneuvering in an uncertain area (i.e. landmarks, routes, and conditions in that area they had never encountered before), tend to keep their engines running for a variety of reasons. That burns fuel.

(We also discovered that combat vehicle fuel consumption wasn’t as much of a factor as convoy vehicles, like fuel trucks, because there were less than 60 tanks in the unit we analyzed. There were over 2,300 non-combat vehicles.)

Rule 6: What You Measure Least May Matter Most

Much of the value we’ve generated for our clients has come through measuring variables that the client thought were either irrelevant or too difficult to measure. But often, these variables provide far more value than anyone thought!

Fortunately, you can learn how to measure what matters the most. The chart below demonstrates some of the experiences we’ve had with combating this phenomenon with our clients (Figure 3):

measurement inversion examples

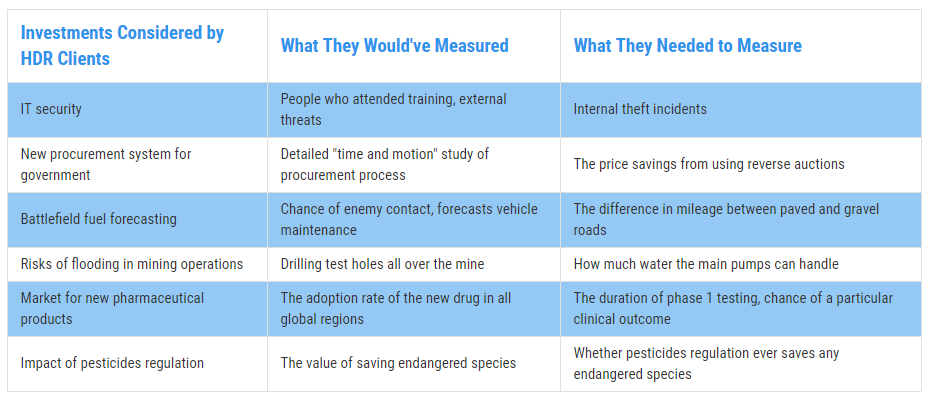
Figure 3: Real Examples of Measurement Inversion – Hubbard Decision Research

This isn’t to say that the variables you’re measuring now are “bad.” What we’re saying is that uncertainty about how “good” or “bad” a variable is (i.e. how much value they have for the predictive power of the model) is one of the biggest sources of error in a model. In other words, if you don’t know how valuable a variable is, you may be making a measurement you shouldn’t – or may be missing out on making a measurement you should.

Rule 7: You Don’t Have to Beat the Bear

When making measurements, the best thing to remember is this: If you and your friends are camping, and suddenly a bear attacks and starts chasing you, you don’t have to outrun the bear – you only have to outrun the slowest person.

In other words, the quantitative method you use to make measurements and decisions only has to beat the alternative. Any empirical method you incorporate into your process can improve it if it provides more practical and accurate insight than what you were doing before.

The bottom line is simple: Measurement is a process, not an outcome. It doesn’t have to be perfect, just better than what you use now. Perfection, after all, is the perfect enemy of progress.

Incorporate these seven principles into your decision-making process and you’re already on your way to better outcomes.


Learn how to start measuring variables the right way – and create better outcomes – with our two-hour Introduction to Applied Information Economics: The Need for Better Measurements webinar. $100 – limited seating.


RECOMMENDED READING:

GOING BEYOND THE USUAL SUSPECTS IN COMMERCIAL REAL ESTATE MODELING: FINDING BETTER VARIABLES AND METHODS

Commercial real estate modeling is becoming more widespread, but is still limited in several crucial  ways.

ESTIMATING THE TRUE NUMBER OF INFECTIONS OF THE 2019 NOVEL CORONAVIRUS

Is the number of people infected by Covid-19 being underreported? Here’s why we think that may be the case – to a significant degree.


WHAT THE MANHATTAN PROJECT AND JAMES BOND HAVE IN COMMON - AND WHY EVERY ANALYST NEEDS TO KNOW IT

Decisions aren’t made in a vacuum. They’re made in real life, and the best way to simulate the randomness in real life is through this powerful tool.

Estimating the True Number of Infections of the 2019 Novel Coronavirus: Reasons for Potentially Massive Underreporting

wuhan coronavirus analysis

There is good reason to believe that the number of the 2019 novel coronavirus- or 2019-nCoV – infections worldwide may be much greater than what has been reported so far.  As of Tuesday, February 3, 2020, at 8:00am CST (UTC-6) the Johns Hopkins coronavirus tracking map shows there are 17,489 confirmed inflections.   Of course, even in the best reporting systems, augmented with the fastest diagnoses, any number of reported infections would almost certainly be too low.  However, our analysis points to a number of infections that may be in the hundreds of thousands, or possibly over one million – far above the latest official numbers.

Many informative analyses already exist on this outbreak, and it was relatively easy to build a model that accurately predicts the next few days of deaths and reported infections (Figure 1).

wuhan flu coronavirus

Figure 1: Prediction made on 1/25/2020 using a naïve exponential growth (daily) of 0.26 and a probability distribution function for time to death based off initial data. (http://www.nhc.gov.cn/yjb/s3578/202001/5d19a4f6d3154b9fae328918ed2e3c8a.shtml).

There is much more uncertainty regarding the total number of cases and infections. This number is crucial because it can inform the international community in terms of expected cases. The number of expected cases then informs decision-making and resource allocation from governments and non-governmental organizations (NGOs) to combat the spread. Too much uncertainty in either direction – overestimating versus underestimating – can result in efforts that are inefficient at best and ineffective or even harmful at worst.

While articles already exist that put the number of total cases at 75,000, we believe there is still a crucial distinction that hasn’t been incorporated: the incubation time and exponential growth of the virus, which can make the infections an order of magnitude higher than the symptomatic cases.

If the calculations in this article are correct, then there are already dozens of cases of 2019-nCoV in the United States, many of which will go undetected.

We support these assertions using two different methods of calculation, both of which depend, in part, on the fact that the average time to death from infection is long (25 days or greater on average, based on initial data). These calculations also depend on the observations that the average time from becoming infected to going to the hospital is 10-15 days; that only 20% of those infected ever require hospitalization; and that average time from hospitalization to death is relatively long (12 to 18 days).

Based on these calculations, we encourage world citizens and governments to all act now to prepare for a world-wide pandemic.

We begin by stating the summary of concerns:

  1. 2019-nCoV is not like the seasonal flu – it is more contagious, has a longer incubation period, has a much higher rate of serious complications (ICU bed requirement), and is deadlier, with a fatality rate that is five to 30 times higher.
  2. Curious patterns in the data indicate the possibility of massive underreporting.
    a. This could partly due to the characteristics of the disease itself – a long incubation period and significant period of time from initial
    symptoms to the development of more serious symptoms.
    b. It could also be due in part to human systems for detecting the disease. Even assuming competence and best intentions, there are factors                       that will contribute to under-reporting in the early parts of an epidemic and during the period of exponential growth.

We remain impartial regarding whether China is intentionally misrepresenting data. Regardless, social media videos out of China on 1/23/2020 appear to indicate a gap between what was reported and what was actually occurring on the ground in the Wuhan province. Keep in mind that at the time China had reported only 21 deaths, while Wuhan was treating coronavirus in 20+ hospitals. While the baseline for hospitals in China may be more chaotic then Europe or the US, the videos do not appear to be consistent with something less impactful than the seasonal flu. Here is a scene from one of those Wuhan hospitals on 1/23/2020.

The Importance of Symptomatic Vs. Infected

As we mentioned, organizations across the globe are rushing to provide analysis and understanding. What we haven’t seen yet in any analysis, however, is a sobering realization: that the length of time from infection to death implies a number of infections that is two orders of magnitude higher than the current reports.

The lengthy incubation period represents a lag between the time someone becomes infected by the virus and when they begin to show symptoms. The incubation period for the common cold is anywhere from 24 to 72 hours; for the garden-variety flu, it’s two days on average. The incubation period for the Spanish flu, the deadliest pandemic in the history of the world after the Black Death, had an incubation period of two to seven days.

2019-nCoV, by contrast, has an incubation period that lasts an average of five to 10 days.

Incubation periods matter because the longer infected persons go without showing symptoms, the longer they go without seeking care and the more people they expose to the pathogens they carry inside of them. Calculating the number of people who have shown symptoms of 2019-nCoV, then, carries the risk of grossly undercounting the number of people who are actually infected.

A compelling picture of this issue is illustrated by comparing the number of infections and the number of symptomatic cases (Figures 2-4).

Figure 2: Monte Carlo Simulation results illustrating difference between infected and symptomatic cases (log scale).

Below we include individual histograms for both infections and symptomatic cases that illustrate the difference between reported cases, calculations based on current international symptomatic cases, and our calculations based on a Monte Carlo model that incorporates the incubation period. Note the scale on infections (Figure 4) is 10-15 times larger than the scale on symptomatic cases (Figure 3).

Figure 3: Symptomatic Cases of 2019-nCoV in Wuhan on Jan 23rd (histogram of 10,000 trials of a Monte Carlo model).

Figure 4: Infections of 2019-nCoV in Wuhan on Jan 23rd (histogram of 10,000 trials of a Monte Carlo model).

Even Thursday’s Lancet paper, which is backing out 75,000 Wuhan infections as of 1/25/2020 is low for the same reason – they are using international “infections” as their starting point and observing it is an unrealistic number given a mere 3,300 daily international passengers out of Wuhan before the quarantine. But the results are likely low because of the nature of growth and long incubation period of this virus – they can only count the “symptomatic” international cases – not the infected international cases.

How Lagging Indicators Obscure Reality

Sometimes, our understanding of the actual magnitude of an event, like a pandemic, is limited by the fact that even in the best of circumstances, data often lags behind the pace of reality.

Based on the published case history of the first 17 deaths occurring from 2019-nCoV, the average time from infection to death is 22-35 days (1-14 days for incubation, five days from onset of symptoms to hospitalization, and 12-18 days from hospitalization to death). In addition, only 20% of those infected ever require hospitalization.

We also have the epidemiological reality that time to death is always underrepresented during the exponential growth phase of an epidemic because the people who take a long time to die haven’t died yet.

The implications of this long time from infection to death makes it difficult for the public to comprehend, during the early stages, the stunning nature of the implied exponential growth in cases.

Put another way, the situation could very well be worse than we believe because we expect the numbers we receive in the news to be closer to the truth than what they really are: a snapshot of the past that grows older and more obsolete at a dizzying pace.

To be conservative, let us assume that the average time to death from infection is 25 days (the Monte Carlo simulations with the best fit to deaths is 29 days from infection to death). This implies that, given a 2.5% fatality rate, and that 362 people have died, there were 14,480 cases 25 days ago. Stated otherwise, given that it takes 25 days to die from infection, 14,480 were infected as of 1/9/2020! (At the time, the official number of confirmed cases was just 41.)

Combine this with a fearsome exponential growth from 1/9/2020 until the quarantine on 1/23/2020 and one starts to get the picture.

Shedding Light on Exponential Growth Rates with Probabilistic Models: How Many People Are Really Infected?

We still can’t make a definitive estimate of exponential growth, in part, because it changes over time as behaviors change. However, the beauty of a probabilistic model, one using initially wide ranges for variables, is that we can quickly discern certain values of variables that are unrealistic. In other words, the model can rapidly narrow the wide amount of uncertainty we have about a given variable (i.e. infection rates).

Using this method, we have concluded that the unrestrained (i.e., before quarantine) log growth rate of 2019-nCoV is at least 0.26 and as high as 0.31. This implies a doubling time in the initial stages of the outbreak of between 2.3 and 2.7 days – far less than other published estimates. A shorter doubling time represents the virus spreading faster among a given population. When coupled with the other observations the international community has gathered about the virus, the models give us a range of likely outcomes that reduce the uncertainty to as much as possible given what we know now.

The results are disquieting. Our best estimates for current infections are 800,000 in Hubei/Wuhan and 337,000 in the rest of China (Table 1).

wuhan flu predicted infections deaths

Table 1: Monte Carlo predictions for current levels of 2019-nCoV in Hubei, China ex Hubei, and International.

How Could This Be?

Skeptics at this point will say, “How could 1,000,000 people in Wuhan be sick? That would imply that every 8th person was sick and that would be all over the media!”

First, there has been very little reporting out of Wuhan in the last week. Governments at all levels have moved to restrict access into and out of the quarantine zone, leaving first-hand news via uncontrolled sources in scant supply.

Second, there is a big difference between 1,000,000 infected and 1,000,000 sick. Because the incubation period is so long, even if 1,000,000 were infected, only a few hundred thousand might be symptomatic.

Skeptics might still say, “How could even 300,000 be sick when the official number is only 11,000?” Recall that the average time from becoming symptomatic to going to the hospital is five days, and that only 20% ever require hospitalization. That means only 60,000 of those 300,000 will require hospitalization. Add in the average lag between being symptomatic and hospitalization, and physical limitations at hospitals, and 11,000 is a very reasonable number of reported cases.

Therefore, it is entirely believable that 1,000,000 people are infected with 2019-nCoV as of 2/3/2020, and with 500,000 infections realized before the time the quarantine was in place on 1/23/2020.

If this is true, then at least 200 infected people flew to international destinations before the quarantine, and 75,000 infected people traveled to domestic Chinese destinations before the quarantine. Given the exponential rate of growth discussed previously, it is possible – perhaps likely – that the original Wuhan quarantine was too little, too late to keep the pandemic from spreading.

Implications for Mainland China

The bad news is that given there are likely hundreds of thousands of infections in China, it is unlikely that China will be “open for business” in the next month – possibly even the next several months. Undoubtedly, the unprecedented quarantine and public health measures China has taken will have reduced the log growth rate of new cases. However, because of the long incubation time and the uncertainty around reporting, we will have wide error bars around our estimate of the new rate of growth for several weeks.

Implications for Other Countries

Given how contagious the disease is, and the continued free flow of international travel from other Chinese ports up through 2/1/2010, an international pandemic likely at this point.

However, there is reason to be encouraged by the international response thus far. The numbers of reported and predicted infections are relatively low, and many people with the virus have largely self-quarantined, which helps tremendously.

The biggest issue is that our sample of infected people is going to be skewed toward the responsible people. Responsible actors will appear in reports; less responsible actors may not. People who have visited China in January and don’t self-quarantine, or who display very moderate symptoms, could slip through the cracks. There is already evidence that infected people with few symptoms can infect clusters of people. The possibility for an epidemic in another country comes if these clusters aren’t immediately caught.

How might this happen? Here is an actual story that has already been reported. An older couple from Wuhan visited their daughter in Shanghai some time during the week before 1/15/2020. They were infected with 2019-nCoV; the daughter soon caught it as well. The daughter then flew to Germany on the 15th and spent a week with colleagues before returning to Shanghai on 1/22/2020. She only became symptomatic after leaving Germany, but had infected several Germans before doing so.

What Do I Do?

Hope is not a good strategy to mitigate risk. While positive interpretations of the data exist, counting on that to be reality sets us up to repeat the initial mistakes in early January to contain and mitigate the virus.

Most humans don’t like to think about things like this because cold, uncompromising reality is uncomfortable, forcing us to decide to either change our habits or face the possibility of disease or death. Nevertheless, making rational decisions to protect yourself based on a sound statistical and logical analysis has helped many millions of lives in the course of human history.

Our recommendation is that we directly address the issue that the current and eventual spread and magnitude of the outbreak could be worse than we believe or imagine, bearing in mind that it is possible we may only have a few days before outbreaks start popping up in the U.S. and possibly just weeks before a general epidemic begins stateside.

Part of the resistance to thinking about pandemics is that it is easy (but incorrect) to assume that we are powerless to affect the outcome. Here are three easy things we can do on a personal level:

  • Wash our hands. This isn’t as easy as it sounds – it means creating a new habit where we wash or disinfect our hands whenever we’ve contacted a public surface (grocery cart, bathroom door handle, etc.). Disinfecting helps. Washing and scrubbing with soap for 15 seconds is the formal protocol.
  • Some published research shows that elderberry syrup may reduce the severity of other types of flu viruses and reduce the probability of transmission.
  • If there is a cluster or outbreak in your city, minimize or avoid public gatherings and wear protective facemasks in public. This is probably the most difficult one because it comes at a high social cost some people aren’t willing to pay.

Preparations for Your Business

If you’d like help preparing your business for the possibilities, there are certain practices you can adopt now that will give you an advantage regardless of outcome (such as reviewing your capabilities for remote work). Also, if you’d like to use or test scenarios on the Monte Carlo model we created, please contact us. One of the advantages of using a probabilistic model is that you can update the uncertainty in real time and always know what contingencies you need to put in place for the most likely scenarios.

Matt Millar is a senior quantitative analyst with Hubbard Decision Research. Contact Matt for more information on this article or any of the methods discussed wherein.


RECOMMENDED READING:

TROJAN HORSE: HOW A PHENOMENON CALLED MEASUREMENT INVERSION CAN MASSIVELY COST YOUR COMPANY

Measuring the wrong variables is a Trojan horse that infiltrates virtually every organization. This phenomenon has a real cost that can be measured – and avoided.

TWO WAYS YOU CAN USE SMALL SAMPLE SIZES TO MEASURE ANYTHING

A measurement isn’t useless if the sample size is small. You can actually use small sample sizes to learn something useful about anything – and use that insight to make better decisions.

Five Data Points Can Clinch a Business Case

Any decision can be made better through better measurements – and as these three examples show, just five data points can tip the scales in a business decision.


Trojan Horse: How a Phenomenon Called Measurement Inversion Can Massively Cost Your Company

measurement inversion

Overview:

  • A Trojan horse is anything that introduces risk to an organization through something that appears to be positive
  • Measuring the wrong variables is a Trojan horse that infiltrates virtually every organization
  • This phenomenon has a real cost that can be measured – and avoided

The Trojans stood at the walls, drunk from victory celebrations after they had previously watched the Greek fleets set sail away in retreat, having been defeated after nearly 10 years of constant warfare. They had little reason to suspect treachery when they saw the massive wooden horse just outside their gates, apparently a gift offering from the defeated Greeks. Because of their confidence – or overconfidence – they opened the gates and claimed the wooden horse as the spoils of war.

Later that night, after the Trojans lay in drunken  stupor throughout the city, a force of Greek soldiers hidden in the horse emerged and opened the gates to the Greek army that had not retreated but had actually lay in wait just beyond sight of the city. Swords drawn and spears hefted, the Greek soldiers spread throughout the city and descended upon its people.

The end result is something any reader of The Illiad knows well: the inhabitants of Troy were slaughtered or sold into slavery, the city was razed to the ground, and the term “Trojan horse” became notorious for something deceitful and dangerous hiding as something innocuous and good.

Organizations are wising up to the fact that quantitative analysis is a vital part of making better decisions. Quantitative analysis can even seem like a gift, and used properly, it can be. However, the act of measuring and analyzing something can, in and of itself, introduce error – something Doug Hubbard calls the analysis placebo. Put another way, merely quantifying a concept and subjecting the data to an analytical process doesn’t mean you’re going to get better insights.

It’s not just what data you use, although that’s important. It’s not even how you make the measurements, which is also important. The easiest way to introduce error into your process is to measure the wrong things – and if you do, you’re bringing a Trojan horse into your decision-making.

Put another way, the problem is an insidious one: what you’re measuring may not matter at all, and may just be luring you into a false sense of security based on erroneous conclusions.

The One Phenomenon Every Quantitative Analyst Should Fear

Over the past 20 years and throughout over 100 measurement projects, we’ve found a peculiar and pervasive phenomenon: that what organizations tend to measure the most often matters the least – and what they aren’t measuring tends to matter the most. This phenomenon is what we call measurement inversion, and it’s best demonstrated by the following image of a typical large software development project (Figure 1):

measurement problems

Figure 1: Measurement Inversion

Some examples of measurement inversion we’ve discovered are shown below (Figure 2):

measurement inversion examples

Figure 2: Real Examples of Measurement Inversion

There are many reasons for measurement inversion, ranging from the innate inconsistency and overconfidence in subjective human assessment to organizational inertia where we measure what we’ve always measured, or what “best practices” say we should measure. Regardless of the reason, every decision-maker should know one, vital reality: measurement inversion can be incredibly costly.

Calculating the Cost of Measurement Inversion for Your Company

The Trojan horse cost Troy everything. That probably won’t be the case for your organization, as far as one measurement goes. But there is a cost to introducing error into your analysis process, and that cost can be calculated like anything else.

We uncover the value of each piece of information with a process appropriately named Value of Information Analysis (VIA). VIA is based on the simple yet profound premise that each thing we decide to measure comes with a cost and an expected value, just like the decisions these measurements are intended to inform. Put another way, as Doug says in How to Measure Anything, “Knowing the value of the measurement affects how we might measure something or even whether we need to measure it at all.” VIA is designed to determine this value, with the theory that choosing higher-value measurements should lead to higher-value decisions.

Over time, Doug has uncovered some surprising revelations using this method:

  • Most of the variables used in a typical model have an information value of zero
  • The variables with the highest information value were usually never measured
  • The most measured variables had low to no value.

The lower the information value of your variables, the less value you’ll generate from your model. But how does this translate into costs?

A model can calculate what we call your Overall Expected Opportunity Loss (EOL), or the average of each expected outcome that could happen as a result of your current decision, without measuring any further. We want to get the EOL as close to zero as possible. Each decision we make can either grow the EOL or shrink it. And each variable we measure can influence those decisions. Ergo, what we measure impacts our expected loss, for better or for worse.

If the variables you’re measuring have a low information value – or an information value of zero – you’ll waste resources measuring them and do little to nothing to reduce your EOL. The cost of error, then, is the difference between your EOL with these low-value variables and the EOL with more-valuable variables.

Case in point: Doug performed a VIA for an organization called CGIAR. You can read the full case study in How to Measure Anything, but the gist of the experience is this: by measuring the right variables, the model was able to reduce the EOL for a specific decision – in this case, a water management system – from $24 million to under $4 million. That’s a reduction of 85%.

Put another way, if they had measured the wrong variables, then they would’ve incurred a possible cost of $20 million, or 85% of the value of the decision.

The bottom line is simple. Measurement inversion comes with a real cost for your business, one that can be calculated. This raises important questions that every decision-maker needs to answer for every decision:

  1. Are we measuring the right things?
  2. How do we know if we are?
  3. What is the cost if we aren’t?

If you can answer these questions, and get on the right path toward better quantitative analysis, you can be more like the victorious Greeks – and less like the citizens of a city that no longer exists, all because what they thought was a gift was the terrible vehicle of their destruction. 


Learn how to start measuring variables the right way – and create better outcomes – with our hybrid learning course, How To Measure Anything: Principles of Applied Information Economics.


These Two Problems Are Why Innovation Initiatives Fail

innovation problems

Overview:

  • The most common reason organizations fail at innovating might not be what you think
  • Defining what innovation means to an organization is critical for success
  • Even the best-defined innovation initiatives fail if they aren’t properly measured

Innovation has captured the imagination of business leaders everywhere. Everyone wants to create that ground-breaking, disruptive product or service that turns the industry on its head. Or, at the very least, they want to move toward changing anything – paradigms, processes, markets, you name it – that will take the organization to that next level.

Unfortunately, many innovation initiatives fail, a failure being an outcome which is disproportionately smaller than expectations, allocated resources, or both. They happen quite commonly, and business literature is rife with reasons why, ranging from not having ideas that are “good” to not having the right people, enough budget, or an accepting culture.

The main reason an innovation initiative fails, however, is more fundamental: companies aren’t doing a good enough job defining what innovation actually means and then measuring it.

The Innovation Definition Problem

Decision-makers that this very moment are spending a staggeringly-high percentage of their revenue trying to innovate often don’t have a firm definition of what innovation means – and this isn’t just academic. 

Innovation is a vague, mostly meaningless term that obscures what you’re really trying to accomplish. It can mean almost anything. Everyone has a definition; here’s 15 of them.

What we’ve found when faced with these terms (and there are a lot of them) is that either the decision-makers know what they want to accomplish, but they don’t know how to measure it, or they think they know what they want to accomplish, but they’re measuring the wrong things (or even pursuing the wrong goal).

So, how do you define the problem? When organizations want to innovate, they’re largely looking to do something that they couldn’t previously do, for the purpose of taking the company to a level it couldn’t previously reach.

How they achieve this is largely a function of two things: impact and timeliness. The earlier a company undertakes an initiative, and the more impact that initiative has, the more innovative a company will be, as shown by the Innovation Time/Impact Square in figure 1:

innovation measurement

Figure 1 – Innovation Time/Impact Square

In our experience, the companies that find the greatest success compared to their peers come up with better ideas – impact – and do so usually before anyone else – timeliness. If your products or services are producing a lot of return, but you are behind the curve, you’re mainly just catching up by implementing best practices. If you’re getting there first, but your concepts aren’t particularly high-value, then you’re underachieving given your abilities. And if your concepts are low value and based only on what others have done before you, you’re falling behind.

Any of the three states of being may be acceptable, but none are examples of innovation. 

What does “impact” mean? One way to define it is to select an objective – revenue growth, higher stock price, more sales, greater market share, or some other desired outcome – and determine the growth target. 

Of course, no organization is going to spend a significant portion of their budget on merely adding a percent or two to their growth, not if they can help it. The allure of innovation is substantial, paradigm-changing growth.

What that growth looks like specifically depends on the firm, but the reality is simple: spending significant resources on innovation – a difficult and costly process – needs to be worth it.

“Timeliness” can mean a variety of things as well. Increasing the quantity of product concepts produced over a given period of time is one definition. Identifying new trends before anyone else is another. Focusing on speeding up the pace at which you create does have value in and of itself, but investing too much in accomplishing this goal can result in lower overall return.

Framing innovation in this way gives you the basis to make better decisions on anything from how much to increase the R&D budget to who you need to hire, what technology you need to acquire, or what you need to do to improve the quality of the ideas your organization creates.

Once you’ve defined what innovation means to your organization, you then have to measure it.

The Innovation Measurement Problem

The innovation measurement problem is simple: companies, by and large, don’t know how to measure this concept. In practice, this means most firms can’t:

  1. Evaluate how “good” they are at innovation, whatever that means
  2. Figure out what it takes to get “better” at innovation, whatever that looks like
  3. Determine the cost of doing those things to get “better” and forecasting ROI

innovation measurement

The first major attempt to accomplish the first task came in 1976, when Michael Kirton produced a paper identifying the two types of creators: adaptors (those who make existing processes better) and innovators (those who do something different). From this effort came the Kirton Adaption-Innovation (KAI) Inventory, which basically provides a person with where he or she falls on this adaption-innovation continuum.

The effort is a noble one, but we don’t have any sense of objective value. Are people at the Innovation end of the scale better at growing a company than the ones at the other end, and if so, by how much? 

These kinds of problems aren’t specific to just the KAI inventory; they’re found in almost every attempt to quantify the processes, impacts, and probability of innovation initiatives. 

For example, some organizations also use what academics call semi-quantitative measures (we call them pseudo-quantitative ones) like the “innovation Balanced Scorecard” promoted in 2015, and the “Innovation Audit Scorecard,” promoted in 2005. The flaws of these particular methods are explained in How to Measure Anything; they include the following:

  • Ranges of values on scorecards are largely arbitrary;
  • Weighting scores is also arbitrary (i.e. how do you know this component, weighted at 15%, is twice as important as one weighted 7.5% Are those individual values accurate?);
  • Estimates are usually subjective and uncalibrated, even from experts;
  • It’s impossible to perform meaningful mathematical operations with ordinal scales (i.e. is something that is a 4 really twice as effective as something that’s a 2?)
  • They don’t incorporate probabilities of outcomes; and
  • Using one gives you the illusion of improving decision-making, even though doing so may actually introduce error (a concept called the analysis placebo)

McKinsey, to its credit, promotes two quantitative metrics to evaluate effectiveness of R&D expenditures (ratio of R&D spending to new product sales and product-to-margin conversion rate), but even this approach doesn’t speak to whether or not the innovation problem lies within R&D – or if focusing on improving these two metrics is the best action to take

Plus, R&D is only one way a company can innovate, per how we defined the concept above, and it doesn’t exist in a vacuum; it is accompanied by a host of other factors and strategies.

There’s a bigger problem, though, with measuring innovation: even if you come up with “good” metrics, no one tells you which “good” metrics have the most predictive power for your organization. In other words, each variable, each measurement, each bit of information you gather has a certain value. The vast majority of the time, organizations have no idea what the value of these pieces of information are – which leads to them measuring what is easy and simple and intuitive rather than what should be measured.

For example, one common metric that is bandied about is the number of patents created in a certain period of time (i.e. a quarter, or a year). Refer back to the Innovation Time/Impact Square above. More patents increase the chance that you’ll get there first, right? Maybe – but that may not make you more innovative. What if you modeled your creative process and actually estimated the market potential of an idea before you developed and patented it and found that your ideas, as it turns out, have consistently low market potential? Then your problem isn’t “How do we create more ideas?”; it’s “How do we create better ideas?”

It doesn’t matter if you know you need to create ideas that are more timely and more impactful if you can’t measure either. You won’t be able to make the best decisions, which will keep your organization out of the rarified air of the innovators.

The bottom line: focusing on defining innovation for your firm and creating better measurements based on those definitions is the only proven way to improve innovation. 


Learn how to start measuring innovation the right way – and create better outcomes – with our two-hour How to Measure Anything in Innovation webinar. $150 – limited seating.


What the Manhattan Project and James Bond Have in Common – and Why Every Analyst Needs to Know It

monte carlo simulation

Overview:

  • A powerful quantitative analysis method was created as a result of the Manhattan Project and named for an exotic casino popularized by the James Bond series
  • The tool is the most practical and efficient way of simulating thousands of scenarios and calculating the most likely outcomes
  • Unlike other methods, this tool incorporates randomness that is found in real-world decisions
  • Using this method doesn’t require sophisticated software or advanced training; any organization can learn how to use it

A nuclear physicist, a dashing British spy, and a quantitative analyst walk into a casino. This sounds like the opening of a bad joke, except what all of these people have in common can be used to create better decisions in any field by leveraging the power of probability.

The link in question – that common thread – gets its name from an exotic locale on the Mediterranean, or, specifically, a casino. James Bond visited a venue inspired by it in Casino Royale, a book written by Ian Fleming, who – before he was a best-selling author – served in the British Naval Intelligence Division in World War II. While Fleming was crafting creative plans to steal intel from Nazi Germany, a group of nuclear physicists on the other side of the Atlantic were crafting plans of their own: to unleash the awesome destructive power of nuclear fission and create a war-ending bomb.

Trying to predict the most likely outcome during a theoretical nuclear fission reaction was difficult to say the least, particularly using analog computers. To over-simplify the challenge, scientists had to be able to calculate whether or not the bomb they were building would explode – a calculation that required an integral equation to somehow predict the behavior of atoms in a chain reaction. Mathematicians Stanislaw Ulam and John Von Nuemann, both members of the Manhattan Project, created a way to calculate and model the sum of thousands of variables (achieved by literally placing a small army of smart women in a room and having them run countless calculations). When they wanted to put a name to this method, Ulam recommended the name of the casino where his uncle routinely gambled away large sums of money<fn>Metropolis, N. (1987). The Beginning of the Monte Carlo Method. Los Alamos Science, 125-130. Retrieved from https://permalink.lanl.gov/object/tr?what=info:lanl-repo/lareport/LA-UR-88-9067</fn>.

That casino – the one Fleming’s James Bond would popularize and the one where Ulam’s uncle’s gambling addiction took hold – was in Monte Carlo, and thus the Monte Carlo simulation was born.

Now, the Monte Carlo simulation is one of the most powerful tools a quantitative analyst can use when incorporating the power of probabilistic thinking into decision models.

How a Monte Carlo Simulation Works – and Why We Need It To

In making decisions – from how to make a fission bomb to figuring out a wager in a table game in a casino – uncertainty abounds. Uncertainty abounds because, put simply, a lot of different things can happen. There can be almost-countless scenarios for each decision, and the more variables and measurements are involved, the more complicated the calculations become to try and figure out what’s most likely to happen.

If you can reduce possible outcomes to a range of probabilities, you can make better decisions in theory. The problem is, doing so is very difficult without the right tools. The Monte Carlo simulation was designed to address that problem and provide a way to calculate the probability of thousands of potential outcomes through sheer brute force.

Doug Hubbard provides a scenario in The Failure of Risk Management that explains how a Monte Carlo simulation works and can be applied to a business case (in this context, figuring out the ROI of a new piece of equipment). Assume that you’re a manager considering the potential value of a new widget-making machine. You perform a basic cost-benefit analysis and estimate that the new machine will make one million widgets, delivering $2 of profit per unit. The machine can make up to 1.25 million, but you’re being conservative and think it’ll operate at 80% capacity on average. We don’t know the exact amount of demand. We could be off by as much as 750,000 widgets per year, above or below.

We can conceptualize the uncertainty we have like so:

  • Demand: 250,000 to 1.75 million widgets per year
  • Profit per widget: $1.50 to $2.50

We’ll say these numbers fall into a 90% confidence interval with a normal distribution. There are a lot of possible outcomes, to put it mildly (and this is a pretty simple business case). Which are the most likely? In the book, Doug used an MC simulation to run 10,000 simulations – or 10,000 scenarios – and tallied the results for each (with each scenario representing some combination of demand and profit per widget to create a loss or gain). The results are described by two figures: a histogram of outcomes (figure 1) and a cumulative probability chart (figure 2)<fn>Hubbard, D. W. (2009). The failure of risk management: Why its broken and how to fix it. Hoboken, NJ: J. Wiley & Sons.</fn>:

Figure 1: Histogram of Outcomes

Figure 2: Cumulative Probability Chart

You, the manager, would ideally then calculate your risk tolerance and use this data to create a loss exceedance curve, but that’s another story for another day. As Doug explains, using the MC simulation allowed you to gain critical insight that otherwise would’ve been difficult to impossible to obtain:

Without this simulation, it would have been very difficult for anyone other than mathematical savants to assess the risk in probabilistic terms. Imagine how difficult it would be in a more realistically complex situation.

The best way to sum up the diverse benefits of incorporating MC simulations into decision models was written by a group of researchers in an article titled “Why the Monte Carlo method is so important today”:<fn>Kroese DPBrereton TTaimre TBotev ZIWhy the Monte Carlo method is so important todayWiley Interdisciplinary Reviews: Computational Statistics 201466): 386– 392.</fn>

  • Easy and Efficient. Monte Carlo algorithms tend to be simple, flexible, and scalable.
  • Randomness as a Strength. The inherent randomness of the MCM is not only essential for the simulation of real-life random systems, it is also of great benefit for deterministic numerical computation.
  • Insight into Randomness. The MCM has great didactic value as a vehicle for exploring and understanding the behavior of random systems and data. Indeed we feel that an essential ingredient for properly understanding probability and statistics is to actually carry out random experiments on a computer and observe the outcomes of these experiments — that is, to use Monte Carlo simulation.
  • Theoretical Justification. There is a vast (and rapidly growing) body of mathematical and statistical knowledge underpinning Monte Carlo techniques, allowing, for example, precise statements on the accuracy of a given Monte Carlo estimator (for example, square-root convergence) or the efficiency of Monte Carlo algorithms.

Summarized, Monte Carlo simulations are easy to use, not only help you more closely replicate real-life randomness but understand randomness itself, and are backed by scientific research and evidence as to how they make decision models more accurate. We need them to work because any significant real-world decision comes with a staggering amount of uncertainty, complicated by thousands of potential outcomes created by myriad combinations of variables and distributions – all with an eminently-frustrating amount of randomness haphazardly mixed throughout.

How to Best Use a Monte Carlo Simulation

Of course, knowing that an MC simulation tool is important – even necessary – is one thing. Putting it into practice is another.

The bad news is that merely using the tool doesn’t insulate you from a veritable rogue’s gallery of factors that lead to bad decisions, ranging from overconfidence to using uncalibrated subjective estimates, falling victim to logical fallacies, and making use of soft-scoring methods, risk matrices, and other pseudo-quantitative methods that aren’t better than chance and frequently worse.

The good news is that all of those barriers to better decisions can be overcome. Another piece of good news: you don’t need sophisticated software to run a Monte Carlo simulation. You don’t even need specialized training. Many of the clients we train in our quantitative methodology don’t have either. You can actually build a functional MC simulation in native Microsoft Excel. Even a basic version can help by giving you more insight than you know now; by giving you another proven way to glean actionable knowledge from your data.

On its own, though, a MC simulation isn’t enough. The best use of the Monte Carlo method is to incorporate it into a decision model. The best decision models employ proven quantitative methods – including but not limited to Monte Carlo simulations – to follow the process below (figure 3):

decision analysis process

Figure 3: HDR Decision Analysis Process

The outputs of a Monte Carlo simulation are typically shown in that last step, when the model’s outputs can be used to “determine optimal choice,” or, figure out the best thing to do. And again, you don’t need specialized software to produce a working decision model; Microsoft Excel is all you need.

You may not be creating a fearsome weapon, or out-scheming villains at the baccarat table, but your decisions are important enough to make using the best scientific methods available. Incorporate simulations into your model and you’ll make better decisions than you did before – decisions a nuclear physicist or a secret agent would admire.


Recommended Products:

Learn how to create Monte Carlo simulations in Excel with our Basic Simulations in Excel webinar. Register today to get 15% off with coupon code EXCEL15.

Are We Already In a Recession?

recession risk

Overview:

  • Fears of a recession are rising as experts attempt to predict when a recession will officially occur
  • Forecasting a recession, for most practical purposes, is irrelevant to decision-makers
  • Decision-makers need to ask the right questions that will help them mitigate the risk a recession poses

A Google search of “risk of recession” uncovers a treasure trove of prognostication, hand-wringing, and dire predictions – or sneering dismissals – involving whether or not the U.S. economy will soon take a nosedive.

Global Recession Will Come In 9 Months if Trump Takes This One Step, Morgan Stanley Argues,” from MarketWatch; “Global Recession Risks Are Up, and Central Banks Aren’t Ready,” from The New York Times; “Current U.S. Recession Odds Are the Same as During ‘The Big Short’ Heyday,” from Forbes; all of these articles reflect one of the nation’s most present fears: that the economic wave we’ve ridden for the past 8 years will soon crest, then crash onto the beach.

It’s surely a worrisome time. Even though the economy appears to be going strong – unemployment is still low, credit spreads are stable, etc. – there’s a tremendous amount of uncertainty when it comes to what the economy will do. If we knew when the recession would hit, we’d be able to do something about it, although “do something” is vague and means different things for different people and, frankly, we as a nation aren’t particularly good at knowing what that “something” is, let alone doing it.

Throw in the fact that the formal announcement of a recession always lags when the recession actually began, and our need to be able to predict the expected downturn only grows.

But two things are very possible, maybe even probable:

  1. The recession has already begun; and
  2. Asking when the recession will happen is completely irrelevant.

It Doesn’t Matter If We’re In a Recession Right Now

If a time traveler came to you from ten years from now and told you that this day marked the official beginning of the Great Recession Part 2: Judgment Day (or whatever clever name economic historians will bestow on it), would it make a difference?

Probably not, because it would be too late to take actions to avoid the recession, since it’s already here.

But even if the time traveler instead said that the recession would start three months from now, or six months, or 12 months, would that make a difference? Possibly – but it’s also very possible that the economic risks that collectively cause and make up a “recession” have already started impacting your business.

And if you knew that the recession was six months down the road, maybe you put off taking the actions that you need to take today (or needed to take X months ago) in order to mitigate the damage your organization could incur.

No matter how you slice it, asking “When will we be in recession?” or “Are we already in a recession?” is not only mostly irrelevant, but also largely counterproductive because it takes our focus off what we should already be doing: asking the right questions.

Questions we should ask instead are:

  1. What impact will a recession actually have on my organization?
  2. What specific economic risks are most likely for me?
  3. When would these risks start impacting my organization? Can I tell if they already have?
  4. What can I do today to mitigate these risks as much as possible?

All of these questions are completely independent and not reliant on knowing when a recession will happen. Remember, what constitutes a recession is completely arbitrary. It’s also one broad term for dozens of individual risks that tend to happen in clusters during recession periods but may all begin or end at wildly different times, and have different severity.

Developing answers to the above questions is far more productive than trying to discern when the recession will happen by reading news articles, watching percentages go up and down on TV, or hiring shamans to study chicken entrails. If you can find those answers, you’ll be far ahead of the curve and increase your chances of being in the minority of organizations that not only weathers economic downturns, but actually grows during them.


Recent Posts:


Recommended Products: