How to Make Remote Work Work

How to Make Remote Work Work

(Written by Doug Hubbard)

COVID-19 risks are forcing a lot of firms to implement work-from-home policies. We have some ideas about how to make that work. Like a lot of small consulting firms, the team at Hubbard Decision Research has been working remotely for years, as compared to full time employees and part time subcontractors who have had to go to an office building to work.

For some, working from home may produce distractions that reduce productivity. Managers may feel that, without direct observation, their teams will take advantage of the situation. There are certainly different challenges for working remotely but they don’t have to include reduced productivity. In fact, the flexibility of not spending time in a daily commute could improve productivity if you approach it with well-defined expectations.

Here are a few keys to successful management of remote workers:

1.  Manage by deliverables: You never needed to be looking over your team’s shoulder to ensure they do work, anyway. For one thing, it undermines a sense of trust that is important to work environments. Plus, there is a better way to observe productivity – their actual output. All tasks should have a deliverable, that is, some sort of documented evidence that the work was done. If you assign someone a task to proofread a document, the deliverable should include, the modified document itself, the list of changes and a statement that they feel confident that they have caught everything. Whether the task is writing code, completing a cost benefit analysis, or finishing a presentation, you always want the output anyway. Exactly how long it took my team to do a task is really no concern to me as long as the deliverable met or exceeded expectations and it was done on time. Documented work is also the best data for evaluation of their performance.

2.  Set availability expectations: If you would normally be 9am to 5pm in your office, make the same rules for remote work. If someone is gone for personal reasons, that needs to be on their calendar. If there is nothing on their calendar and they don’t pick up when you call, state the rule for how soon they should be expected to return the call (e.g. 10 minutes).

3.  Keep brief but regular meetings with the team. To get them started on time and manage expectations, it’s often useful to have a quick team meeting. Keep them short and don’t let them turn into a waste of time. Get to the point. Review priorities and expected deliverable times for the day and let them loose.

4.  Use collaborative tools. We like to use Slack and Webex for starters.

In short, the most successful tactics that effect remote work are the same as what works face-to-face. Set expectations, deliver evidence of work and stay connected. If anything, the only difference with remote work is that it may force you to communicate even more than you otherwise would have to make sure you stay productive.

Doug Hubbard Reaches 1000 on ResearchGate

Doug Hubbard Reaches 1000 on ResearchGate

ResearchGate is sort of a “LinkedIn” for authors and researchers where they can post their published work.

Congratulations to Doug Hubbard, whose various books and articles have been currently cited 1000 times by other published works.  Considering Research Gate depends on authors submitting their bibliographies, this is likely a conservatively low estimate.

Doug Hubbard is a Global Thought Leader and heads up the Quantitative Analysis Consultancy, Hubbard Decision Research, outside of Chicago, IL. He teaches, consults and provides tools on how to apply his proprietary method, AIE (Applied Information Economics), in order to measure what matters across any industry and in various disciplines. He works across the globe in building better decision makers. Doug has authored articles in distinguished publications and has written 5 books in eight languages that have sold over 150,000 copies.

  • How to Measure Anything: Finding the Value of Intangibles in Business (one of the all-time, best-
    selling books in business math)
  • The Failure of Risk Management: Why It’s Broken and How to Fix It (1E/2E)
  • Pulse: The New Science of Harnessing Internet Buzz to Track Threats and Opportunities
  • How to Measure Anything in Cybersecurity Risk (co-authored with Richard Seiersen)

Mr. Hubbard’s books are used as textbooks in dozens of university courses at the graduate level. His first book is required reading for the Society of Actuaries exam prep. His fourth book won the Palo Alto Networks Cybersecurity Canon award. Doug is published in the prestigious science journal, Nature, in additions to publications as varied as The American Statistician, CIO Magazine, Information Week, DBMS Magazine, Architecture Boston, OR/MS Today, The IBM Journal of Research and Development and Analytics Magazine.

Learn more about his books here:  https://hubbardresearch.com/publications/

COVID-19 Has You Working From Home? Here’s 50% Off Online Quantitative Training

If you haven’t already been sent home to work in the midst of the spreading COVID-19 pandemic, you may very well find yourself there soon. The government is urging anyone who can work remotely to do so for up to eight weeks (or even longer) as the nation tries to flatten the curve of the pandemic’s growth and keep things under control.

To help our fellow exiles, we are offering a special deal: For as long as the crisis continues, get 50% OFF all online training from Hubbard Decision Research. The list of all eligible webinars is below:

introduction to applied information economics - 1 hour

Wednesday, March 18 3:00pm – 4:00pm CDT

Monday, March 30 9:00am – 10:00am CDT

Tuesday, April 14 9:00am – 10:00am CDT

$100 $50

In this one-hour session, you will get an executive overview of methods that show independently, scientifically measured improvements to management forecasts and decisions. This webinar is an excellent means to learn about the key tools and methods of Applied Information Economics, so you can start applying these trusted practices today to grow your organization’s success. Visit the Checkout Page

calibration training - quantify your uncertainty - 3 hours

Thursday, March 19 3:00pm – 6:00pm CDT

Wednesday, April 15 9:00am – 12:00pm CDT

$580 $290

In this 3-hour Calibration webinar, you will learn the techniques behind subjectively assessing the probability of uncertain events and the ranges of uncertain quantities. This is an essential skill for anyone who needs to consider chance in decisions. Participants will see their skills measurably improve during the training with a series of “calibration exams.”  Visit the Checkout Page

basic simulations in excel - 3 hours

Monday, March 23 12:00pm – 3:00pm CDT

Wednesday, April 22 3:00pm – 6:00pm CDT

$375 $187.50

Simulations have been shown to measurably improve estimates, but many decision models currently lack this critical element. Learn how to create simulations in native Microsoft Excel that can lead to better decisions in any field. Visit the Checkout Page

calibration facilitator training - 1.5 hours

Tuesday, March 24 3:00pm – 4:30pm CDT

$995 $497.50

The Calibration Facilitator Training webinar and follow-up is for already calibrated people and includes everything that somebody needs to run their own calibration session, including a private follow-up observation occurs when the purchaser gives their first live calibration training in their organization or elsewhere. Note: Calibration Training is a prerequisiteVisit the Checkout Page

intermediate simulations in excel - 3 hours

Thursday, March 26 9:00am – 12:00pm CDT

$375 $187.50

Simulations have been shown to measurably improve estimates, but many decision models currently lack this critical element. Learn how to improve on basic simulations in native Microsoft Excel that can lead to better decisions in any field. Note: Basic Simulations in Excel is highly recommended prior to taking this courseVisit the Checkout Page

the failure of risk management - 2 hours

Friday, March 27 9:00am – 11:00am CDT

$150 $75

The biggest risk to an organization is a failed risk management system. In this 2-hour webinar, based on Doug Hubbard’s ground-breaking book The Failure of Risk Management: Why It’s Broken and How to Fix It (now in its second edition), you’ll learn how risk management today is broken, and how organizations can fix their processes and do a better job protecting themselves from risk through proven quantitative methods.  Visit the Checkout Page

applied information economics (aie) analyst training - 9 hours

Monday, March 30 9:00am – 10:00am CDT

Tuesday, March 31 9:00am – 11:00am CDT

Wednesday, April 1 9:00am – 11:00am CDT

Thursday, April 2 9:00am – 11:00am CDT

Friday, April 3 9:00am – 11:00am CDT

$1,450 $725

This series of webinars give the participants hands-on training in the use of Applied Information Economics (AIE), a proven and powerful quantitative analysis method used by Fortune 500 companies, federal and state governments, the U.S. military, and leading multi-national corporations across the globe. It consists of a total of 9 hours of training delivered in five separate modules and teaches participants how to measure any “intangible,” think of risk like an actuary, and look at any portfolio from a risk/return point-of-view. Visit the Checkout Page

how to measure anything in project management - 2 hours

Tuesday, March 31 2:00pm – 4:00pm CDT

Friday, April 17 9:00am – 11:00am CDT

$150 $75

In this two-hour, introductory webinar session, you will get an executive overview of what is wrong with current methods in measurement and risk assessment in project management. We will outline real solutions that are based on real quantitative methods which have scientific evidence of improving decisions. Visit the Checkout Page

how to measure anything in cybersecurity risk - 2 hours

Wednesday, April 1 2:00pm – 4:00pm CDT

Thursday, April 16 9:00am – 11:00am CDT

$150 $75

Do current risk assessment methods in cybersecurity work? Recent big security breaches have forced business and government to question their validity. Is there a way to fix them? How can risk even be assessed in cybersecurity? This two-hour webinar will change how you view cybersecurity and give you the tools to begin finding these critical answers – and better protecting your organization. Visit the Checkout Page

how to measure anything in innovation - 2 hours

Thursday, April 9 2:00pm – 4:00pm CDT

$150 $75

What do we mean by innovation? Can we measure it? And if we can measure it, can we get better at innovating? This two-hour webinar will explain how better measurements can lead to better innovative results. Visit the Checkout Page

In any crisis, there’s opportunity. Now is your opportunity to receive proven, industry-leading quantitative training at a discount and gain the skills you need to measurably improve your performance – whether you’re working from the couch or the cubicle.


Get a more granular, tailored, and accurate estimate of the spread of the pandemic for your organization with our customizable COVID-19 Coronavirus Operational Risk Report. Click below to learn more. 


The CDC Needs a Better Way to Communicate Coronavirus Risk

The COVID-19 coronavirus pandemic is continuing to grow, and the Centers for Disease Control (CDC) is ramping up testing to gather more data on the spread of the virus in the U.S.

Gathering data is a must, but unfortunately, the CDC is running into a very common – and very problematic – risk management problem: using qualitative and pseudo-quantitative methods to calculate and communicate risk.

As you can see in the image above, the CDC is still using “High, Medium, Low” methods for communicating risk to the general public. They are using advanced epidemiological simulations that produce probabilistic results, but, unlike what you’ve seen with hurricane forecasts from the National Oceanic and Atmospheric Administration’s National Hurricane Center, any quantitative analysis is reduced to an ordinal scale for public consumption. This is not actionable for most organizations.

Why?

For starters, an ordinal scale like the one above doesn’t rank magnitude, or the degree to which one thing is “more” than another. In this case, exactly how much more exposure or risk does “High” represent over “Medium?” Put another way, if one location has a “High” rating versus a location with a “Medium” rating, how much more likely are you to become infected if you’re in that first location – 5%, 20%, 80%? There’s no proper context.

Another flaw that flows from these kind of ordinal ranking systems is that you can’t perform math with them. It’s easy to see how you can’t exactly add “High” to “Medium” to get any kind of insight. If we used a 5-point scale instead, and one was a 4 and the other was a 2, is the first location twice as risky as the second location? Is a 3 location three times as risky as a 1 location?

Finally, using a “High, Medium, Low” method doesn’t give you what you need the most: the ability to make informed decisions via quantitative analysis. If we wanted to create a model to forecast the spread of the virus and calculate infection rates, we need the actual data – the numbers of potential cases, confirmed cases, deaths, recoveries; the demographics of the patients and of the location as a whole; observed transmission rates, etc. The CDC would be performing a more valuable service if it made that information readily available to the public so that anyone can use it, but unfortunately, they either are restricting what they publish to the public, or the lack of testing to this point (as of Friday, March 13, only roughly 16,600 tests had been performed, or 0.005% of the population ; South Korea, by contrast, has tested 0.45% of its population, or 90 times the per capita amount in the US).

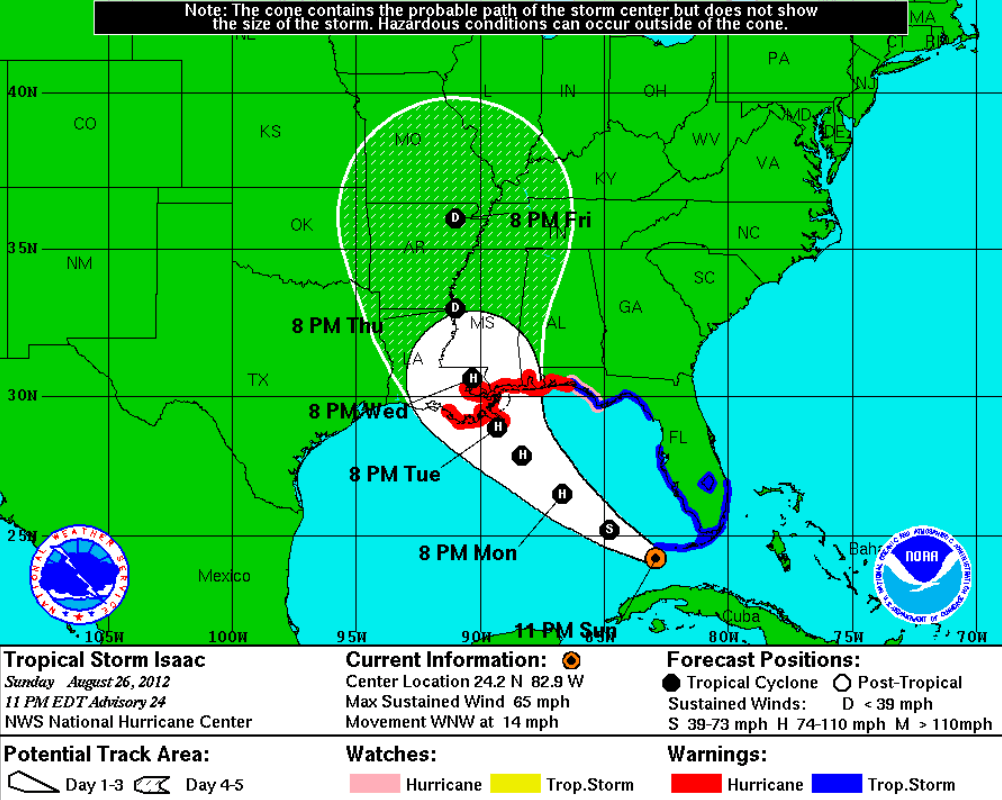
To those who say that the “High, Medium, Low” approach is the best way to inform a large group of people who probably don’t have experience in statistics, we call foul. The National Hurricane Center, as mentioned above, conducts the same probabilistic analysis as the CDC when forecasting the intensity and track of a hurricane. But it doesn’t shy away from numbers; in fact, it produces images like the one below (Figure 1):

Figure 1: National Hurricane Center’s Projection for Hurricane Isaac, August 26, 2012

Everyone can understand this chart. It doesn’t tell you exactly what will happen, but it doesn’t have to. Instead, someone can look at the chart and see what is most likely to happen, when it’s most likely to occur, and how intense the storm will most likely be. All of those conclusions were drawn from analyzing troves of data about wind speed, humidity, internal pressure measurements, water temperature, and the like, so it’s not as if tracking a hurricane is child’s play compared to calculating infection spread. If the NHC can do it, so can the CDC – and they should.

If government agencies want to adequately convey risk to the public – and to their own internal and external decision-makers – then using qualitative and pseudo-quantitative methods like risk matrices, heat maps, and weighted scoring is insufficient at best and dangerous at worst. If we are all to make better decisions regarding the coronavirus pandemic, then we need better efforts from those who we have entrusted with our safety.

Note: The above concepts are explained more completely in The Failure of Risk Management, which can be purchased online here.


Get a more granular, tailored, and accurate estimate of the spread of the pandemic for your organization with our customizable COVID-19 Coronavirus Operational Risk Report. Click below to learn more. 


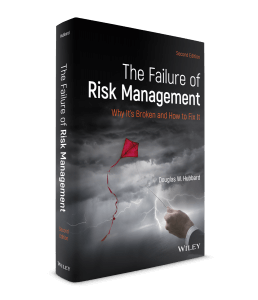
Doug Hubbard’s The Failure of Risk Management Second Edition Is Now Available

 Hubbard Decision Research today announced the release of the second edition of the ground-breaking book on risk management, The Failure of Risk Management: What’s Broke and How to Fix It, published by Wiley and Sons.

The second edition expands upon the central theme of the first edition, which covered misused analysis methods and showed how some of the most popular “risk management” methods are no better than astrology through examples from the 2008 credit crisis, natural disasters, outsourcing to China, engineering disasters, and other notable events where risk management failed. This edition includes new material on simple simulations in Excel, research about the performance of various methods, new survey results, expanded statistical methods, and more

The Failure of Risk Management can be purchased online here. We also have live, online training based on the principles covered in the book in a two-hour webinar that can be found here.

Risk management needs to change, and risk managers need to adopt scientifically-proven, quantitative methods like Applied Information Economics if they hope to get ahead of the curve and reduce risk with confidence instead of wishful thinking.


Learn how to identify flawed risk management methods you may be using and replace them with proven methods with our two-hour The Failure of Risk Management webinar. $150 – limited seating.